Under Analysis you will find some tools which are useful for analysing your event whilst it is ongoing, these are designed you aid you with Timing the event by identifying any erroneous data, most often caused by participant error.
Contest Overview
This gives you an overview of each contest, showing the number of participants signed up, started / on-course and finished in each contest. Hovering over any of the segments gives a breakdown by gender also. You will also see a running clock next to each Contest which shows the elapsed time since T0.

Time Visualisation
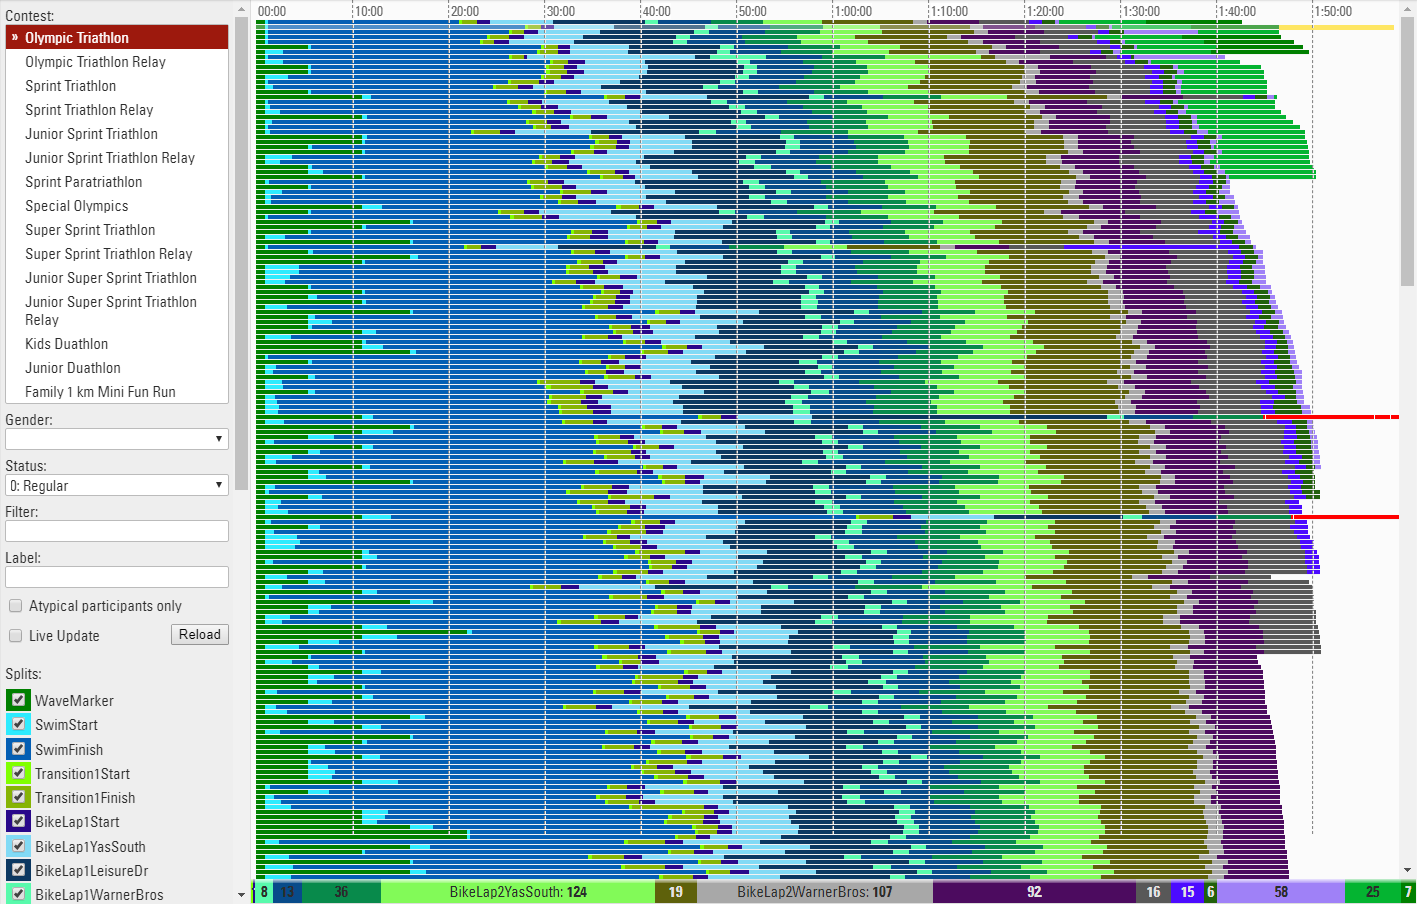
Time Visualisation is a very helpful tool to check if participants miss reads and if times are realistic, or in other words to identify cheaters.

The tool shows one line for each participant. The different colors represent the section times between two split timing points. The length of the bar represents the time and the fastest athletes are at the top.
If you click a line you will see the details and can immediately disqualify the participant.
Use the settings bar on the left to select the contest(s), gender, status or apply any other filter, you should also select the splits or results that will be part of the visualisation. Sometimes you may want to exclude certain times. Usually you will want to see just the key timing data for each Timing Point, not the intermediate split times. A label can be applied to each line, this could be particularly useful when comparing multiple contests together.
If you only want to see participants who are missing data then click "Atypical Participants Only", the view also has a live update checkbox which will refresh the visualisation as new Results are calculated, this is useful for monitoring a race whilst it is in progress.
Best Practice Tip: If you have a large number of splits and the data does not make sense, try deselecting Timing Points to just keep the important Results which show where somebody is on the course as opposed to split times between 2 Results. Sometimes participants standing at the side lines can cause some erratic data as the Visualisation cannot determine the correct order of the Timing Points, it is often best to ignore this data in the participant record.
Read Rates
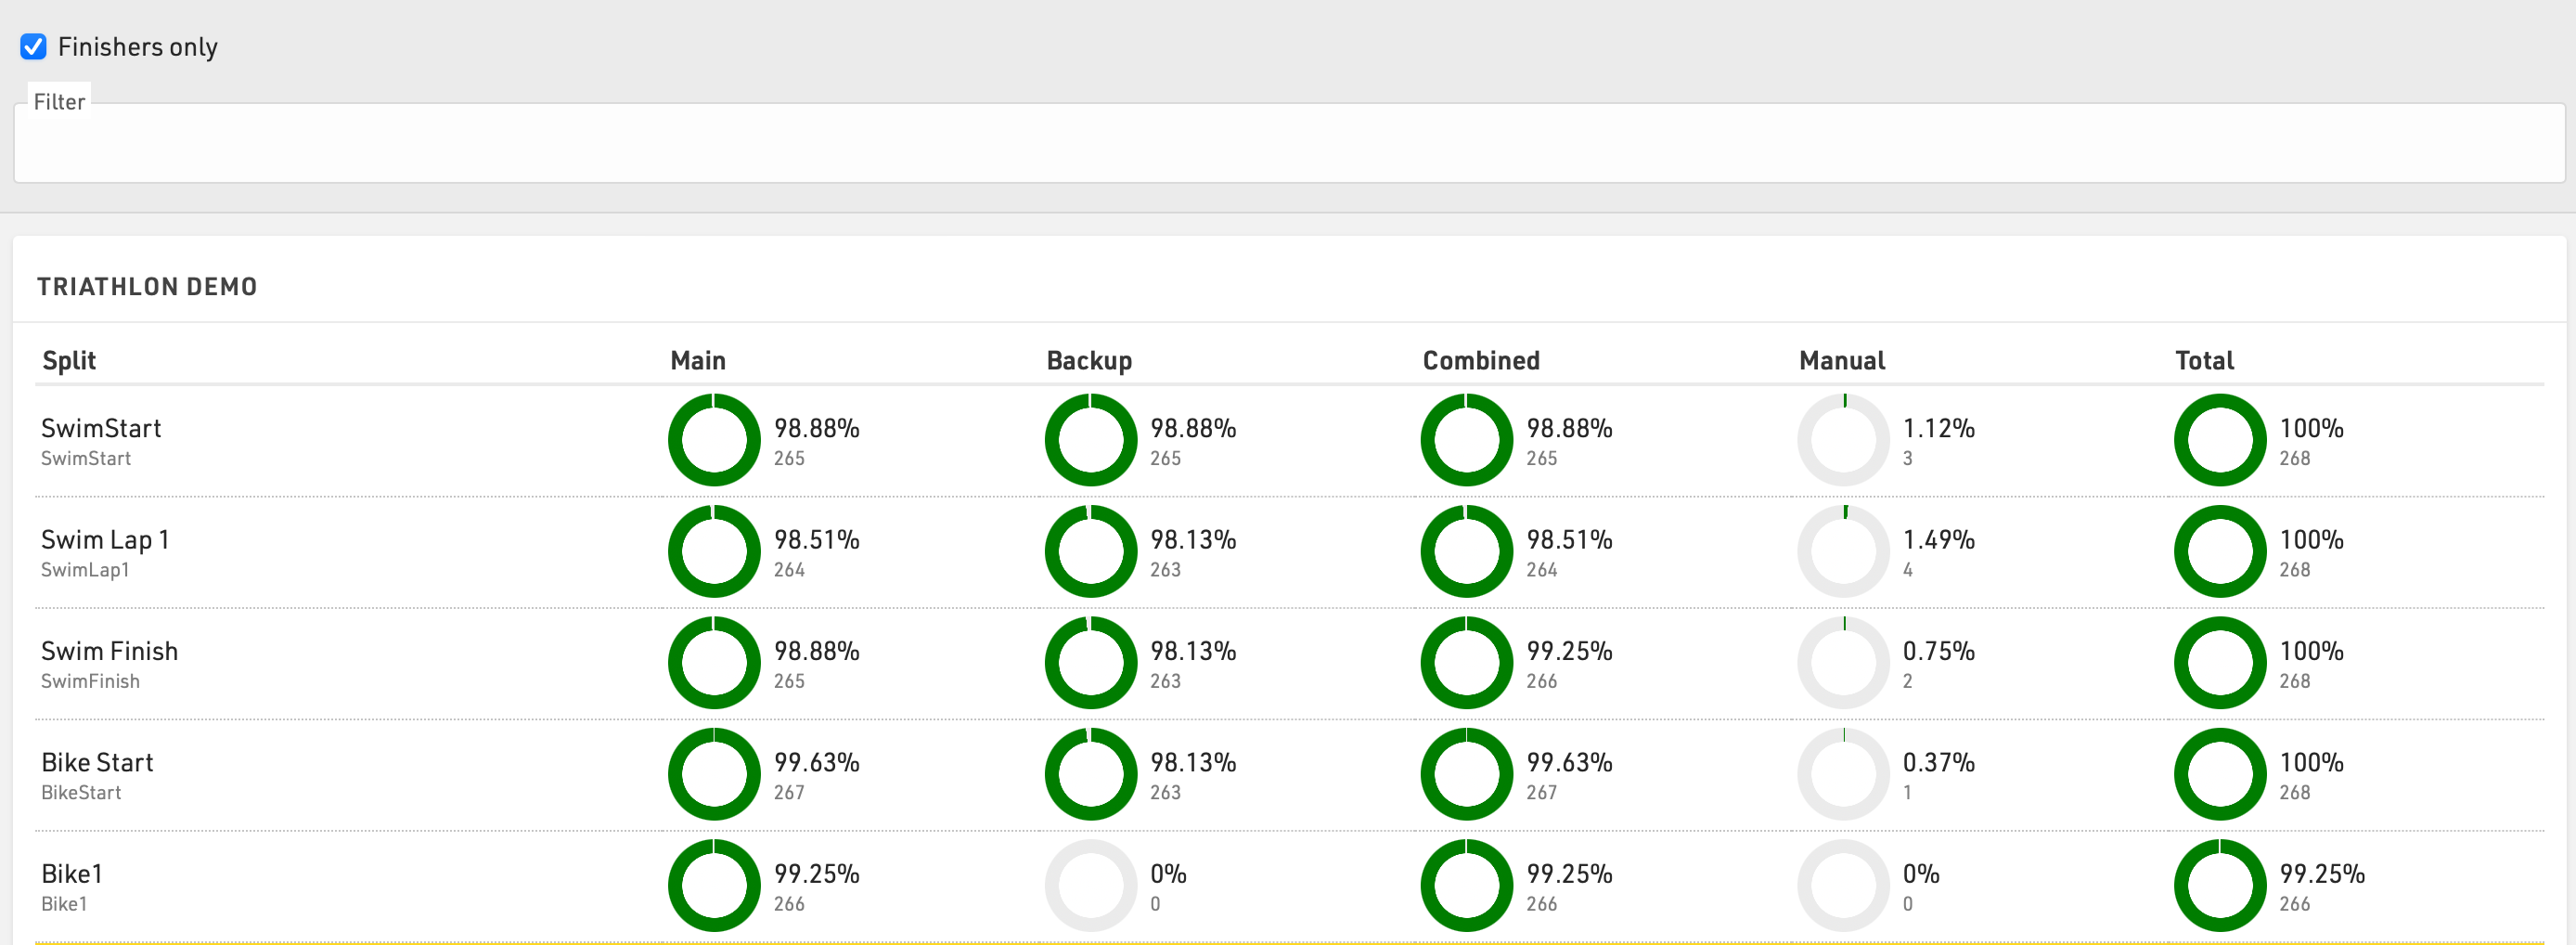
Read rates offers additional analysis of Splits to compare detection rates across the Primary & Backup timing points and also considering any manual raw data entries.
For each Split the expected number of participants is calculated, either based on the number of finishers (if Finishers only is ticked) or by the number of participants seen at this Split or a later one. This is then used to calculate the percentage of participants detected at the main timing point, backup timing point, a combined rate across both, the number of manual reads and the total participants detected at this point across all.
A table is generated for each Contest independently and the total read rates across all Splits is also shown at the bottom of the table.

An additional optional filter can be applied.
Leaderboard
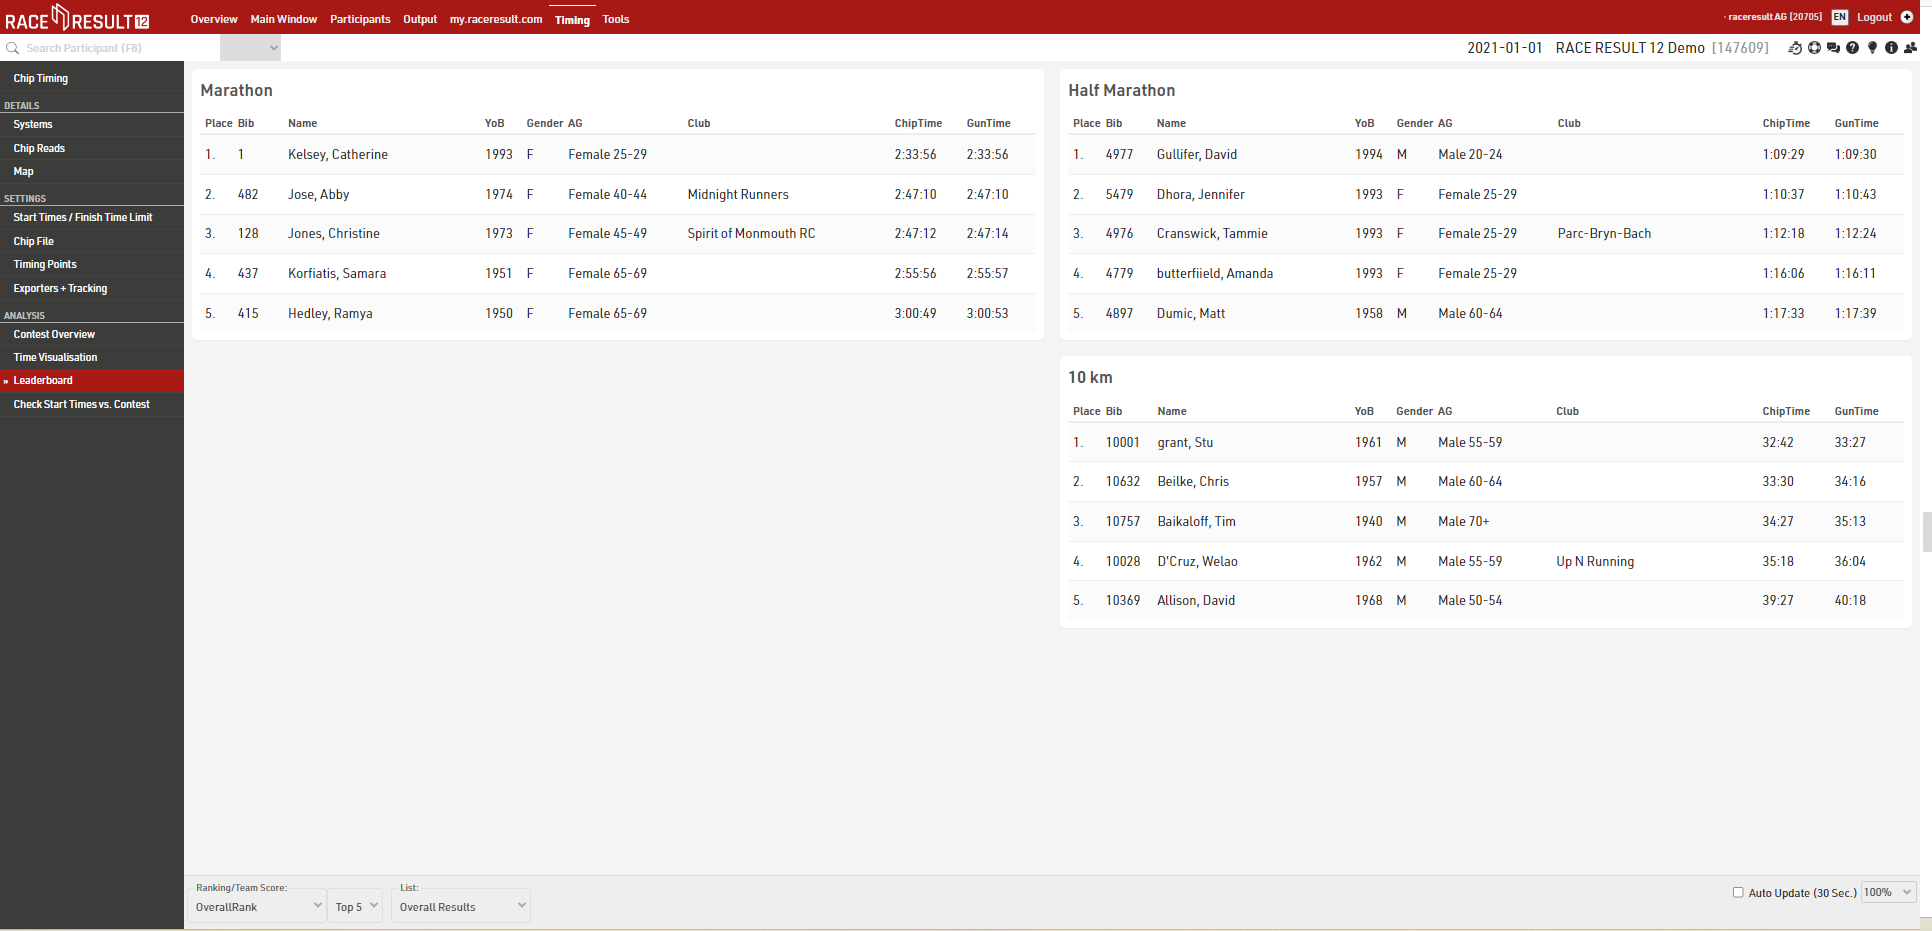
The Leaderboard in the Overview Window shows the winners or current leaders of the event. Through the settings at the bottom of the screen, you can select a Ranking and a number x so that the first x participants in each group of the ranking will be shown.

If you would like to show different columns (or use a different format), you can also select a List from which the column settings will be taken.
Enable the Auto Update checkbox to auto refresh the page every 30 seconds.
Check Start Times vs. Contest
Check Start Times vs. Contest is a helpful tool to find particiants who started in a contest other than the one they registered for. In particular when using Raw Data Mode, these may have no times in their results at all because all raw data detections are filtered due to the wrong contest. In consequence it would be difficult without this tool to find these participants.
Preconditions
Please consider the following preconditions for the tool to work:
- Only works with advanced Results at this time
- The timing system is running on time of day
- Start times will be kept
- The result that holds the start time is selected as Start Result in the Contest Settings.

What you see
- Underneath the headline with the name of the contest, those participants are listed that are registered for that contest, but started probably in another contest.
- The area with gray background color shows the time span the majority of participants needed to complete the proposed contest.
- The red bar, on the contrary, shows the time span of the contest the participant is actually registered for.
- The vertical lines show the participants' chip reads. The legend at the bottom of the screen shows which color belongs to which timing point.
- If there are many reads of the same chip with only small gaps in between, the reads may appear like a bar.
Making changes
You can either change the contest of the participant or change the status (for example to DSQ). When clicking on the bib number, the Participants Window shows on the right side of the screen and you can check the Raw Data in detail before making any changes.