The main screen of the system when powered on shows some fixed system information, current timing information, and the available menu options. The system time is always displayed when on the main screen.

The top row contains the system name and current battery status, the top and bottom display a preview of the next / previous timing information screen.
Battery Status
The current charge level of each battery is shown.
An arrow indicates the charge status for each battery
 |
Battery is charging Time remaining until fully charged |
 |
Battery is discharging Time remaining until empty |
 |
Battery is not currently in use |
System Data
There are 3 datasets can be displayed in the system data area, these can be cycled using the up/down arrow keys. Additionally a short preview of each hidden view is shown at the top / bottom of the screen.
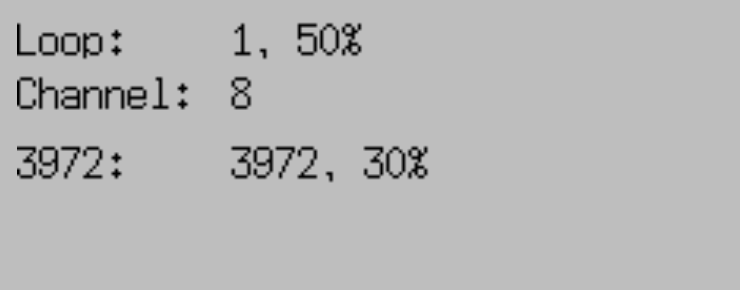
Loop Information
Current system Loop and Channel IDs are shown with the loop power.

Additional systems on the same channel within range are also shown below.
Loop Boxes in range in repeat mode will be listed below with the Loop ID and Loop Power.
Passive Antenna Information
Currently connected antennas are shown with their corresponding antenna number. A solid antenna indicates the antenna is currently detecting a transponder.

If a letter is displayed instead of the antenna number then the antenna is currently reporting an error, the possible errors are as follows:
- B - Bad: The antenna reports high noise (most commonly from reflections or obstruction)
- ? - Unavailable: A previously connected antenna is no longer communicating with the System
- M - Mute: Can occur shortly after booting before an antenna is ready for opreration
- ! - Unknown Error: This should be reported to RACE RESULT for further diagnosis
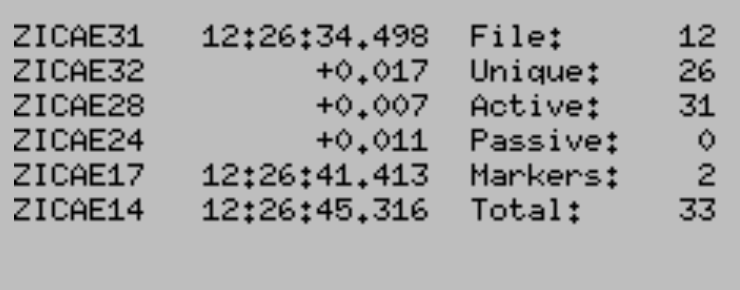
Passing Information
Passing information displays the current last reads on the left side. If the detections are within 1 second of the last timestamp displayed then a gap will be shown rather than the full time.

Additionally displayed on the right side is data relating to the current passings file:
- File Number
- Unique Transponders seen
- Active passings recorded
- Passive passings recorded
- Markers recorded
- Total passings recorded
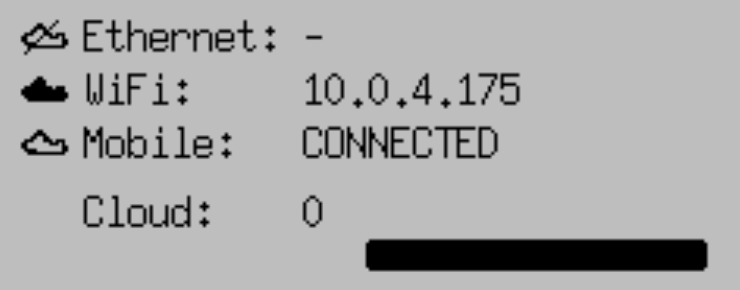
Networking Information
Current connection status for Ethernet, Wi-Fi, Mobile (GSM) and Cloud Connection, for network connections, there are three possible icons.
- Black cloud - This connection is currently being used to connect to the internet
- Cloud outline - This connection has an internet connection available but is not currently being used
- Crossed out cloud - No internet connection is available on this network

When the Cloud upload is enabled then the count of passings which have been uploaded will be displayed below and the status bar will also indicate the percentage of passings which have been uploaded.
Menu Items
From the main screen 4 menu icons are displayed, clicking the corresponding navigation key will open the corresponding menu. Clicking the back key from the main screen will also show the label for each menu.

Inside the menu any sub-menus of that item are shown below, sub-menus and menu items can be accessed by clicking the corresponding navigation key.
If an error has occurred then the General Settings icon may display an exclamation mark, this will be cleared when opening the Error Log.
Text Input (With Keyboard)
Settings which accept a text input will open a keyboard when editing the setting.

The keyboard can be controlled using the keypad on the device. If connected to the same network as Ubidium or to the system Access Point you can scan the on screen QR code to access the system browser interface which will also provide a text input to directly edit the text using your device.