Lists show a defined set of fields for a specific set of records. The settings of a list determine:
- which participants are shown
- which data fields (columns) are shown
- how the records are sorted
- how the records are formatted
- how the page is formatted (page format, margin etc)
Lists are additionally sorted into categories. By clicking the category head, the category can be collapsed and uncollapsed. To create a new category, click the New List Category link at the top. You can also rename List categories.
Lists can be sorted manually via drag&drop. Therefore move the cursor to the free space left of the list name. You can also drag&drop the list into another category. To sort the lists in a category alphabetically, click the  icon. Empty categories will be deleted automatically when you reload the window.
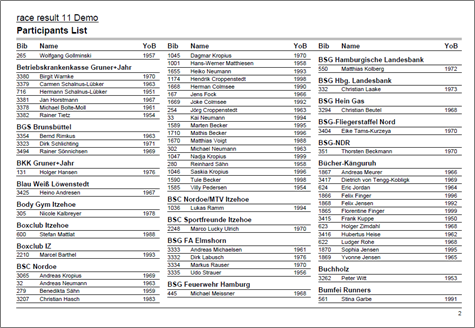
Clicking the name of an output list opens an overview page for that list.
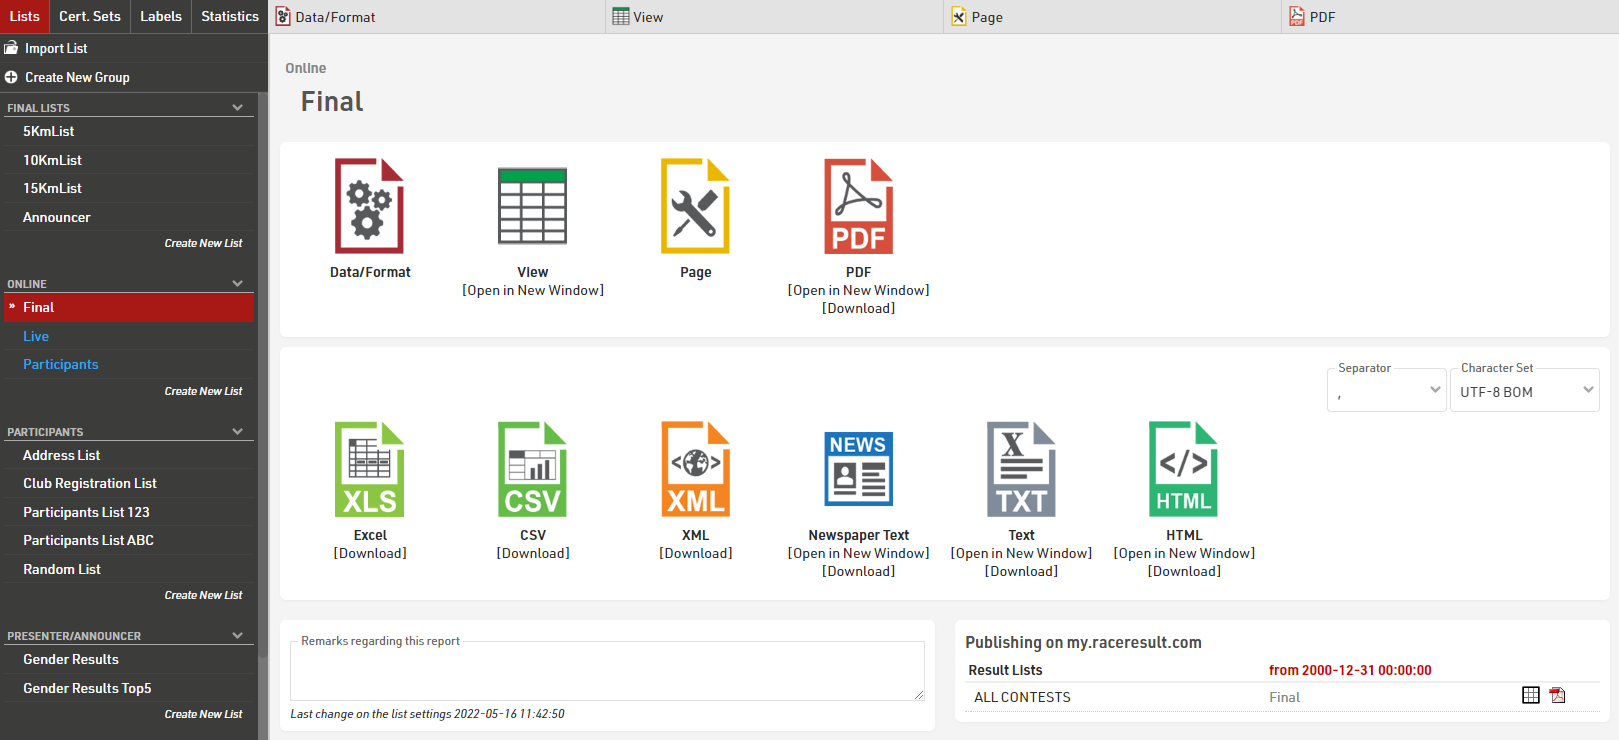
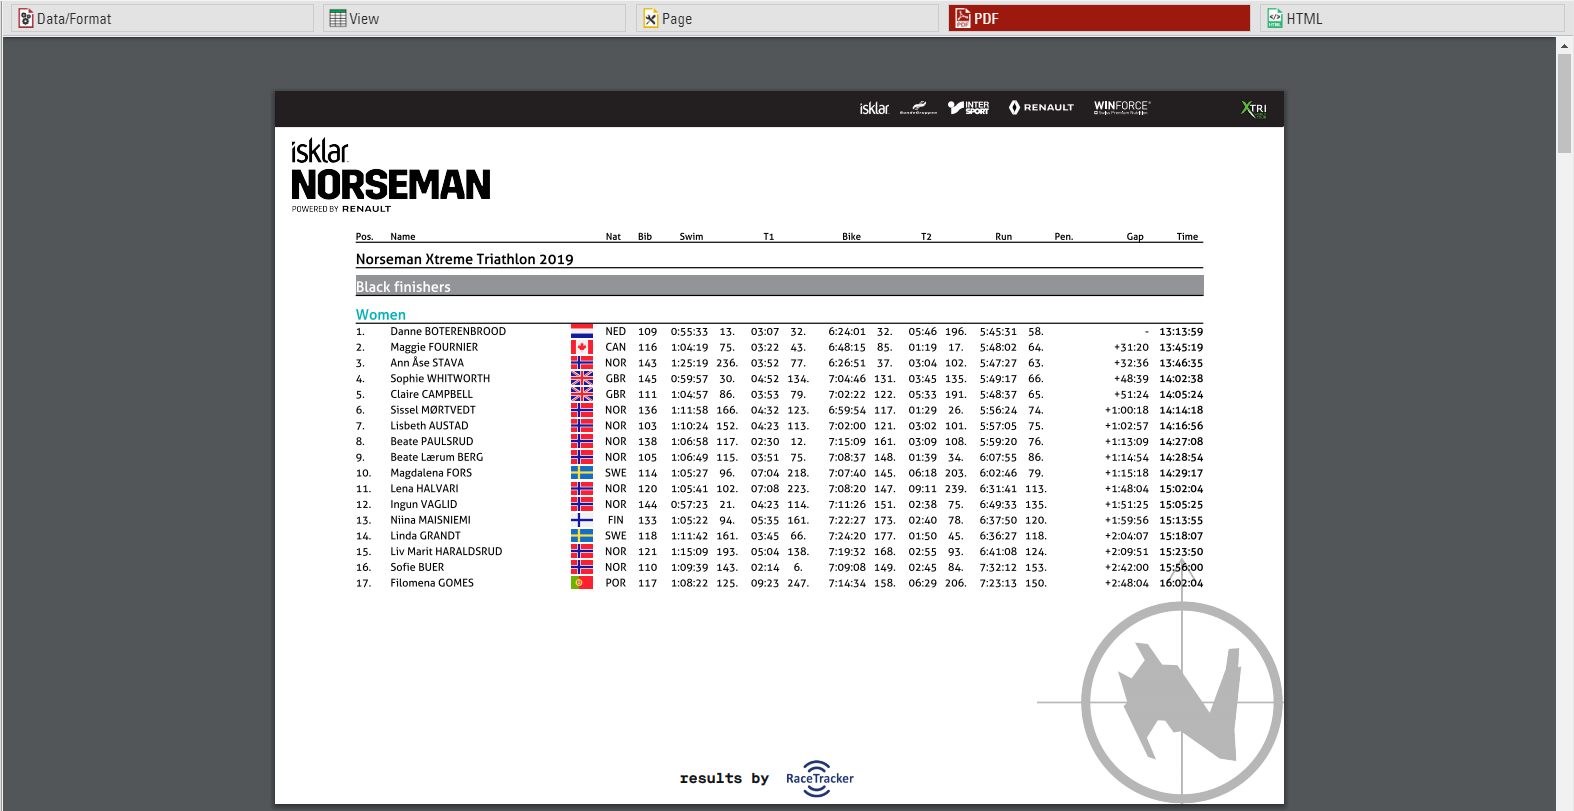
The settings of a list are split into the tabs Data/Format and Page. Data/Format contains all settings regarding the data shown on the list and how it is formatted, whereas the Page settings concern the general page layout and are only relevant for the PDF and HTML output form.
To view a list click the View button or tab, this can also be opened in a new window, lists can also be opened directly to the View tab by double clicking the list name from the menu. A PDF view of the list can also be previewed or downloaded.
Lists can also be exported in different formats as EXCEL, CSV, XML, TXT and HTML.
Data/Format Settings
The Data/Format Settings tab is divided into three sections: Grouping/Sorting, Fields/Columns and Filter. Each of those sections will be explained in the following. According to the settings and selections made in those sections, the participant data will be displayed in the outputlist.
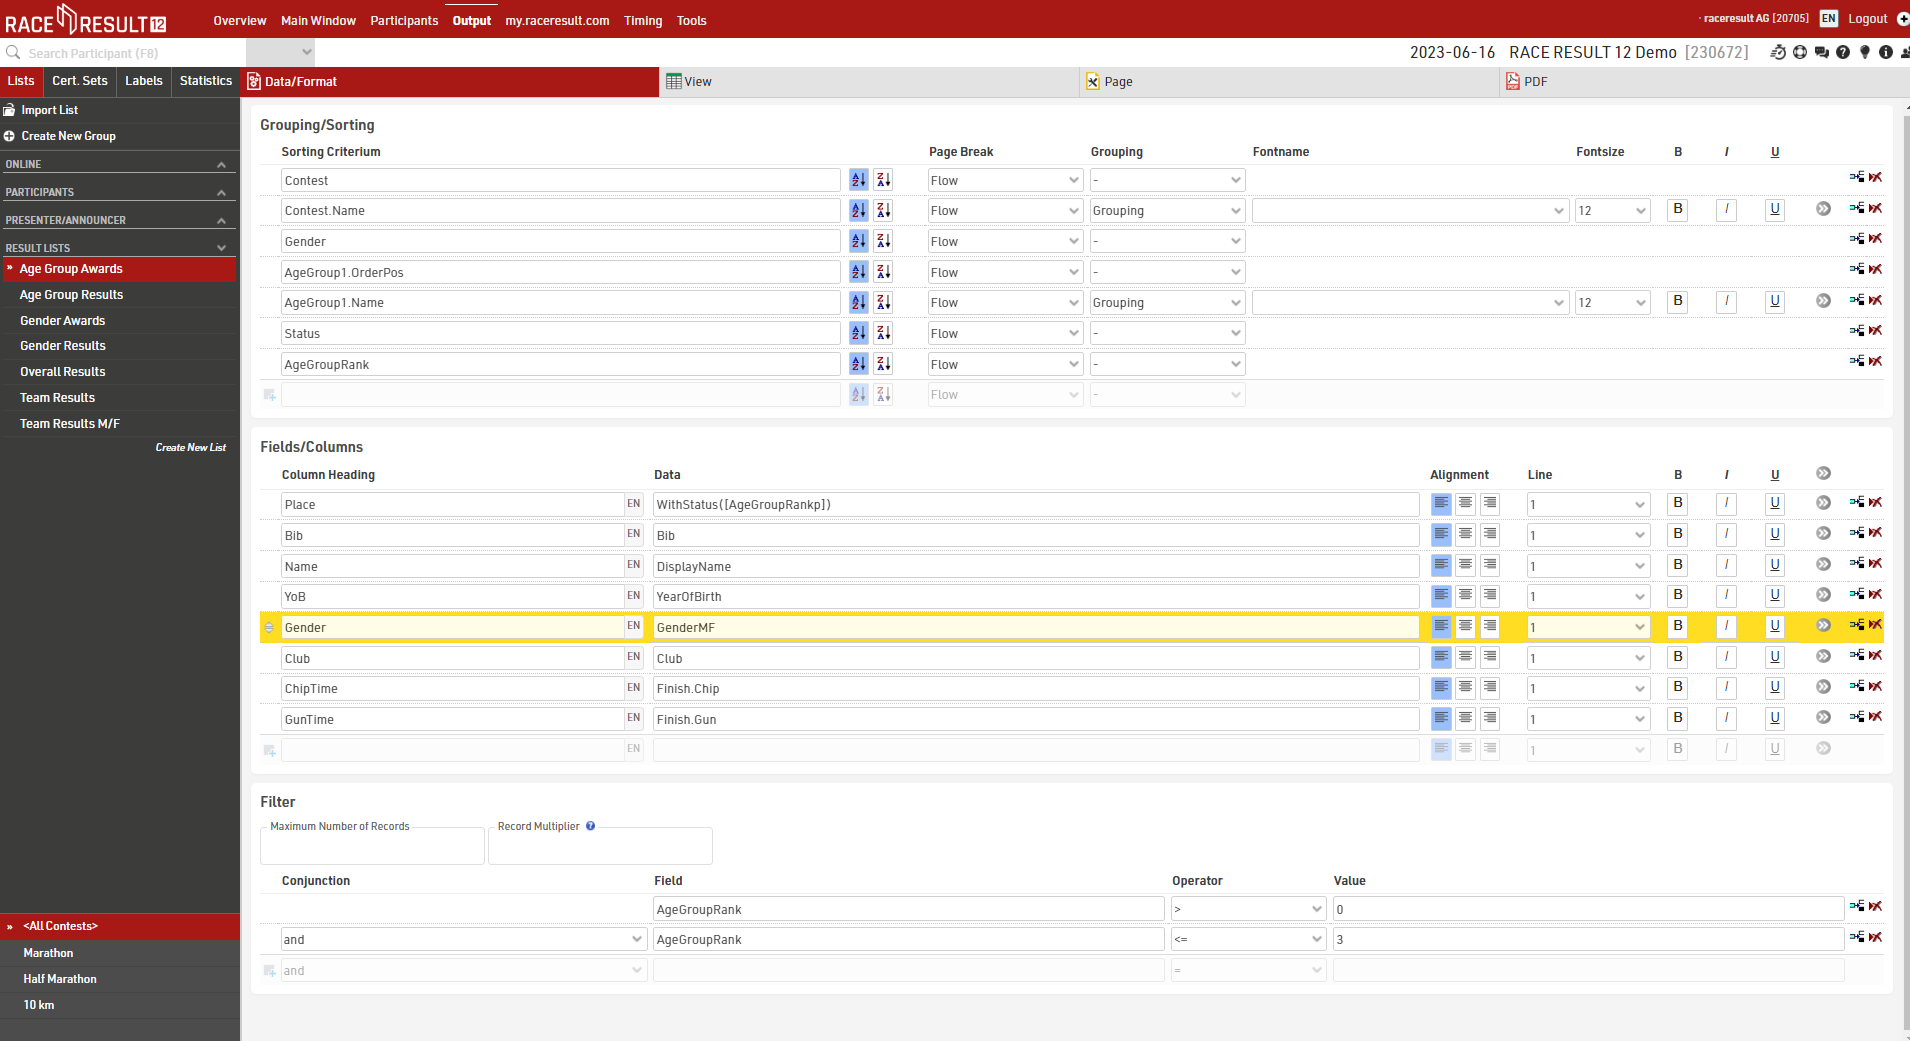
Grouping/Sorting
This section defines how the records on the list will be sorted. Simply select one or more fields from the Field Wizard which pops up below the input box. The list will be sorted by the first field and, if this field is not decisive, by the second, and so on.
Second, choose if the records shall be ordered ascending or descending.
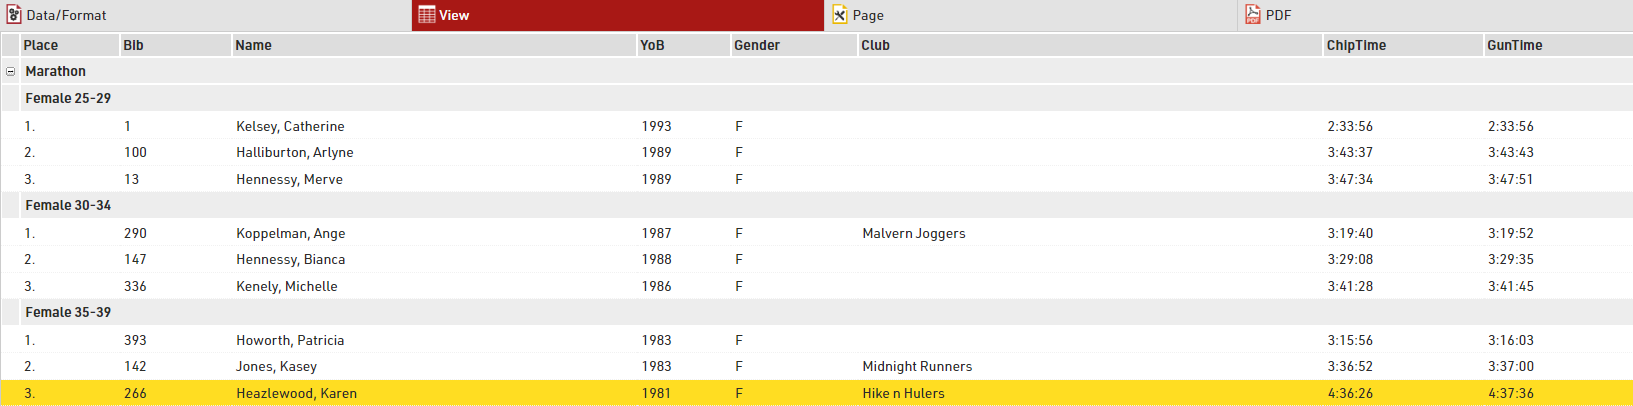
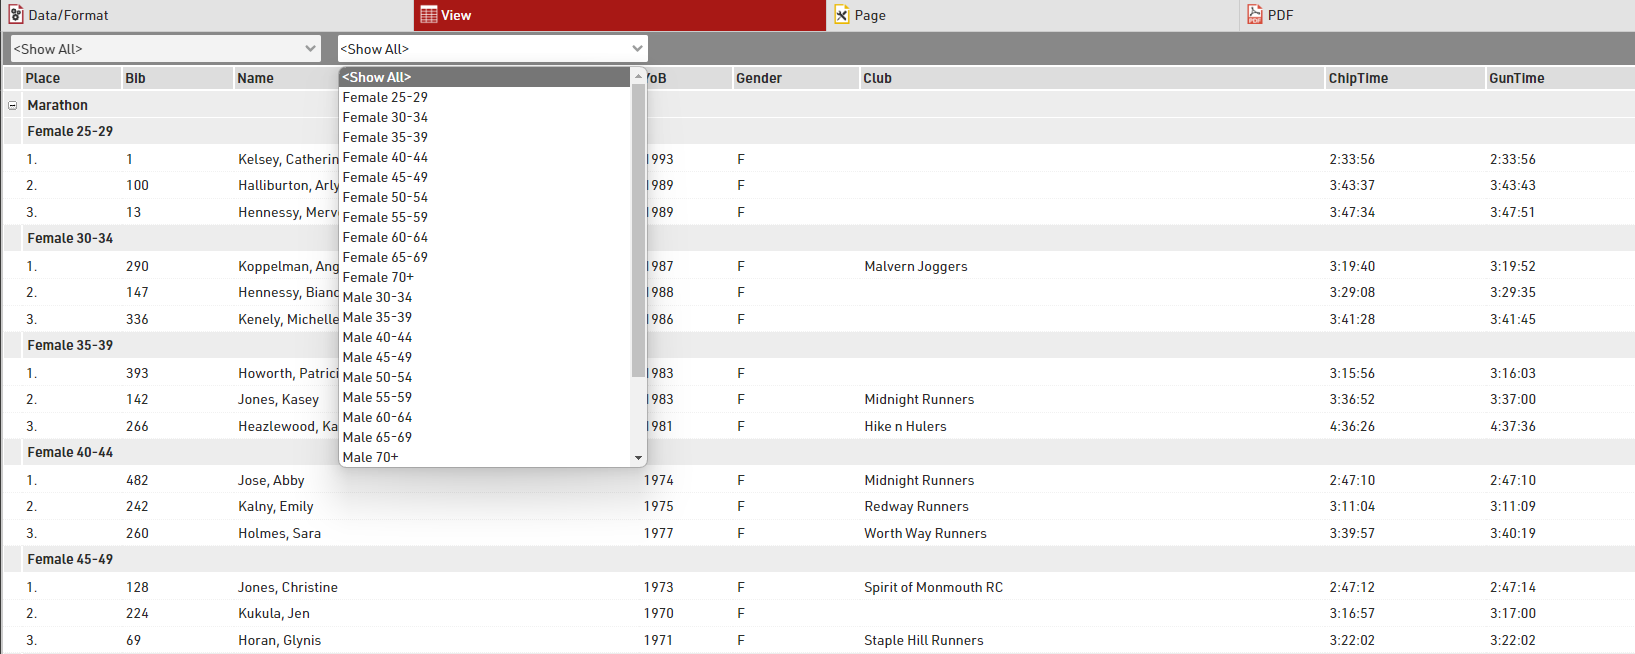
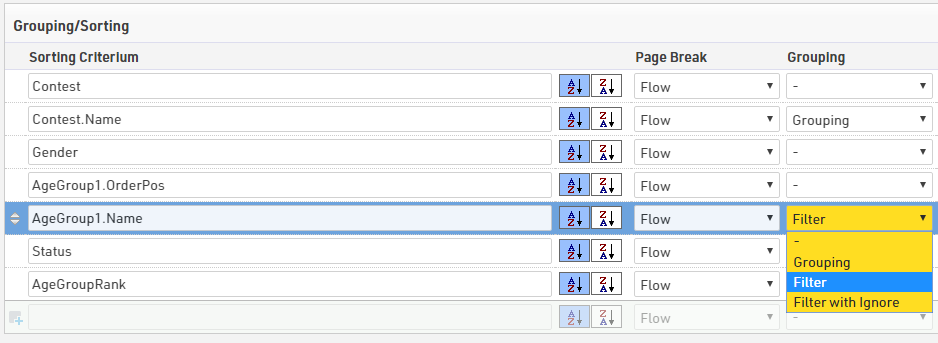
Fields can also be used as a Grouping or Filter, when used as a Grouping then a group header line will be inserted for each group value on all output types. Alternatively a list can be filtered by a group, with this setup an additional dropdown will appear in the preview and also on my.raceresult.com for each filter which can then show all groups, filter to a specific group, or ignore this level of grouping all together (if filter with ignore is selected). Filter is particularly useful for online results to make these easier to navigate / filter to the data somebody actually wants to view.
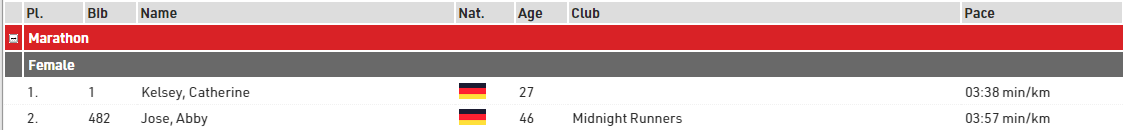
This list is grouped by contest and age group:
and below the same list using a filter instead of simple grouping
See Grouping/Sorting Details for more details and option
Fields/Columns
In the section Fields/Columns select the fields which shall form the columns of your report. In Column Heading enter a description of the field and in Data select a field from the Field Wizard or enter an expression. For example, using an expression you can combine the fields Lastname, Firstname and YearOfBirth to: "Doe, John (70)"
The corresponding expression would be:
[DisplayName] & "(" & [YearOfBirth] & ")"
Select a line number greater than 1 to create Multi-Line Lists.
Click the more details for this field  button to access the Extended List Column Settings.
Filter
By setting a Filter you can exclude certain records from the report. If you do not define a filter all records will be shown on the report.
In particular, filters are important for result lists: you would like to show only those participants that have already finished. Usually, the filter will be that the rank must be greater than 0.
Instead of setting a filter, you can also limit the number of records shown on the list by setting a maximum number of records.
Besides, the Record Multiplier allows to show records more than once with different information (e.g. lap times) on a list.
Grouping/Sorting Details
Page Break
Using the Page Break setting, you can insert page breaks in the PDF output format, when the value of the sorting field changes. The following options are available.
- Flow: Default value. A new page is started if an additional records does not fit on the previous one.
- New Page: if the value of the sorting/grouping changes, a new page begins. For example, a list could have a new page for every contest.
- New Column: the same as New Page, however in case of multi-columned lists, a new column begins, not necessarily a new page.
- Keep Together: it is attempted to show all records of a group on the same page. If not all records fit on one page, a new page is begun. For example in case of team results, a new page can be started, if not the entire team fits on the page.
- Repeat: same as Flow, but the grouping header is repeated on the new page.
Colors
Click the (More Details for this field) button to define font and background colors:
Different Fields for Sorting and Grouping
Frequently, the list shall be grouped by a field, but not sorted by that field, for example sort by Contest ID but show the Contest name. In that case, simply enter the sorting field before the grouping field. In the example below, the list is sorted by the contest id, but the group header will show the contest name. Similarily, within the contests, the list is sorted by the age group position, but the group header shows the age group name:
Filters can also be applied, these allow lists to be filtered manually using additional drop-down selectors according to the available values. These filters will also show on my.raceresult.com when using output lists online. Filter with ignore allows you to also ignore any grouping, for example if filtering by Gender it could be useful to ignore this and show all together. Note that when an ignore is applied then any filters /grouping below this will also be ignored.
Group Header Columns
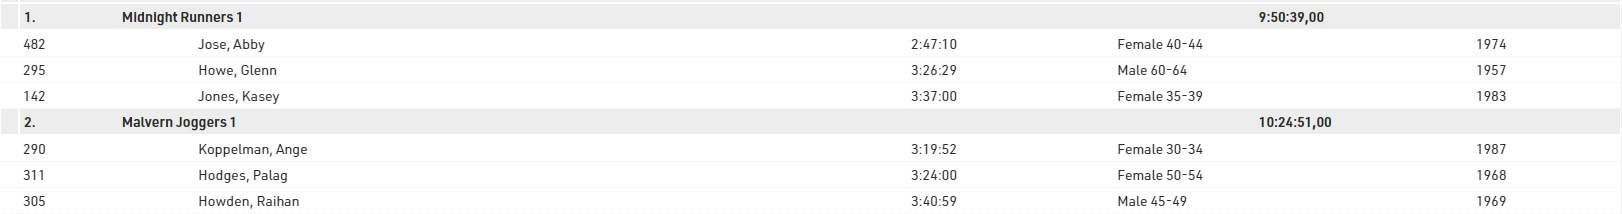
In some cases it is helpful to create columns within the group header, for example in team results. In this case we want to show a group header for each team which has their team rank, team name and team time each in separate columns, then below we will show each team member and their individual details.
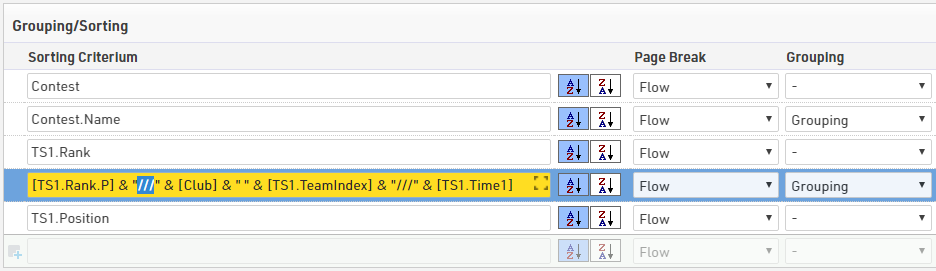
Columns will be created when the value of the grouping field contains three slashes (///). In other words, the three slashes are the column seperator:
Extended List Column Settings
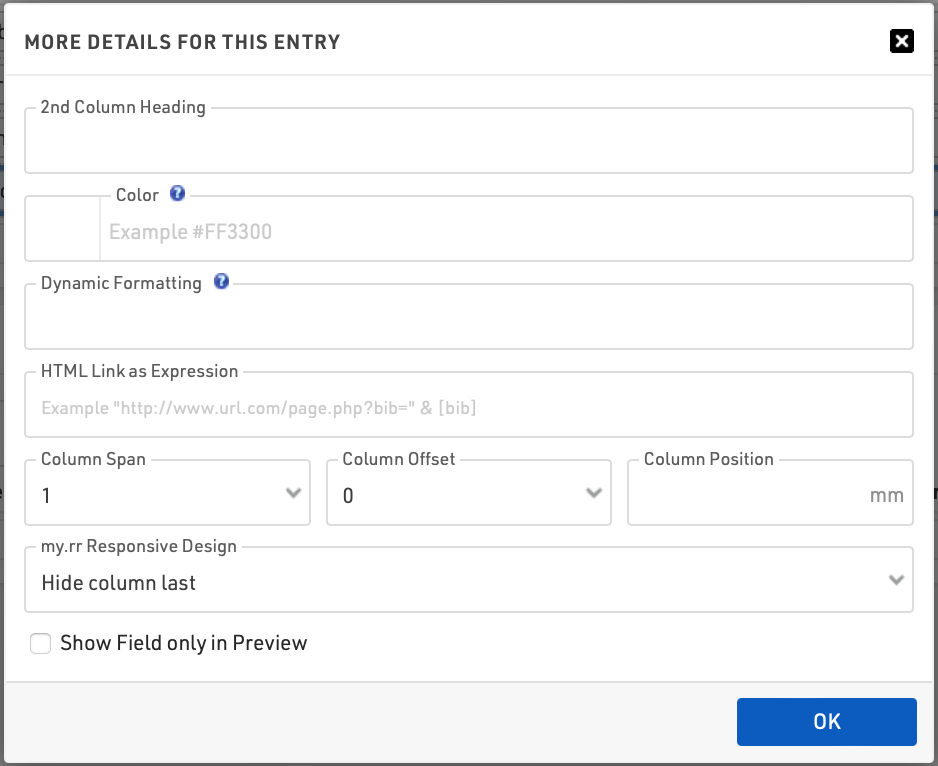
2nd Column Heading
The column header can have two lines. The second line will show if any field has an entry for this setting. This function is sometimes used for printed results that shall have column headings in two languages.
Color
Select a color for this column.
Dynamic Formatting
Different records can be formatted differently, see Dynamic Formatting.
HTML Link as Expression
When clicking a line in that column, the link will be followed. This is mostly used for results published on my.raceresult.com, for example, to create an individual link to a website with photos.
Column Span
If a field should span more than one column then define the column span accordingly, for example in multi-line lists where fields on different rows may have different lengths and so don't align in a single column.
Column Offset
The Column Offset setting serves for multi-line lists, see next section.
Column Position
Normally, RACE RESULT 12 automatically calculates the width of the columns depending on the content. In some rare cases, you may want to set the column position manually (only applies to PDF). Therefore enter the position in millimeters from the left.
my.rr Responsive Design
Use this setting to determine in which order fields should be hidden when being viewed on mobile, or narrower screens, through my.raceresult.com or your own custom embed. This helps optimize the spectator/participant experience since most results views are on mobile devices and you want to ensure that the most important fields are viewed easily. Read more about the Display Logic on Mobile Devices to understand how the settings work.
Show Field only in Preview
The field will only be shown in the preview, but not on the PDF. This may be used for the photo links as described above.
Multi-Line Lists
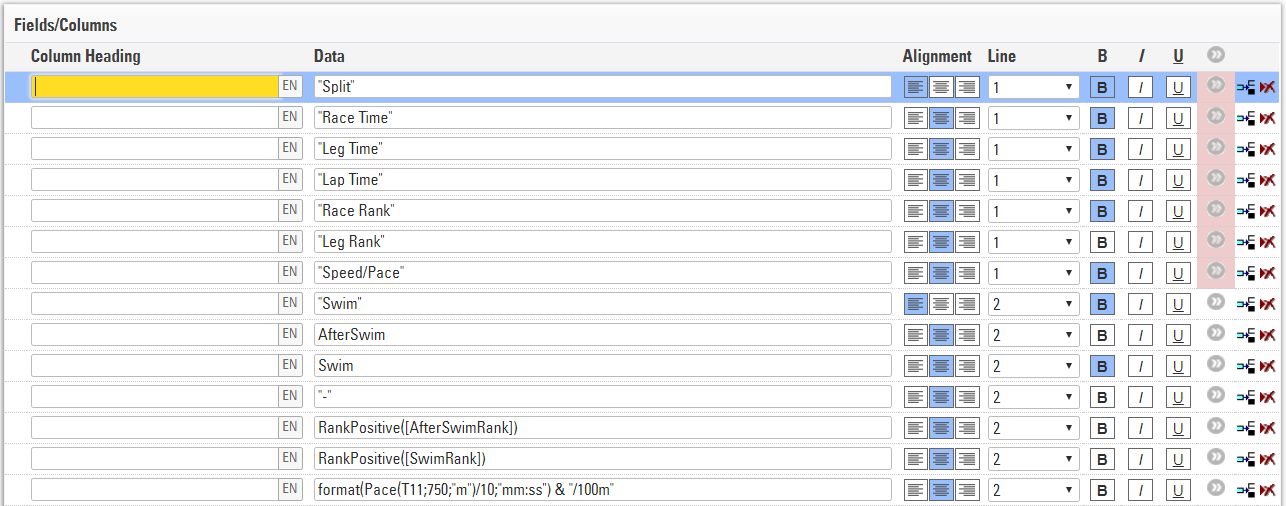
Multi-Line Lists are an easy way to put more information on a list, most commonly used for Details Lists for online results or Results with multiple splits which should be displayed. Each participant record can have up to 50 lines on the list, to create additional rows simply select a line number greater than 1.
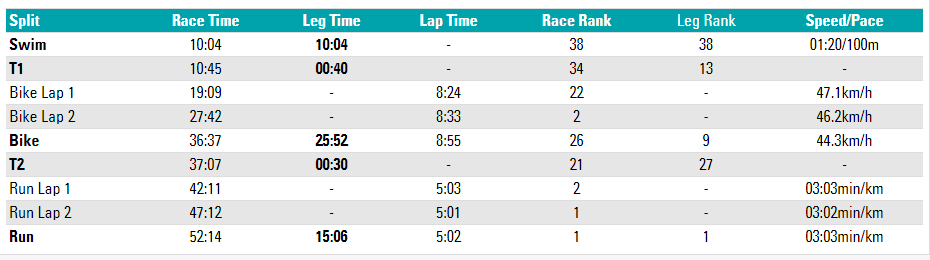
In this example each split for the race is shown on a new line, for each line the data fields are still shown in the order listed. The Row Headers are Line 1, using simple text with custom formatting. It may be necessary to add in blank fields using "" if you need columns to line up correctly.
Maybe you would like to have different column widths for the fields in the different lines like in the screenshot below: the lap times in the second and third line have different column positions than the basic information above. This is only possible in PDF output lists.
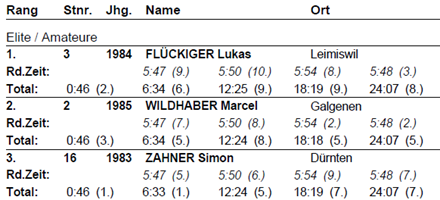
To do so, you have two options:
- Enter the exact column position in the extended field settings. This will disregard the column widths from other rows.
- Set a column offset. All lines will have the same columns, but for example in the second line the field will be moved one or several columns to the right, i.e. the previous column has a greater column span.
Record Multiplier
Using the Record Multiplier, records can be shown several times on a list, optionally with different data, for instance lap times.
The Record Multiplier setting in the Data/Format settings of the list can hold either a fixed value (e.g. 3) or a variable (e.g. DecimalTime6). If the result 6 saves the number of laps, the list will show one line for each lap time.
In order to show the lap times in the lines, the parameter {n} can be used, which will be iterated from 1 to n (=value of the record multiplier). If for example the lap times are saved in results with the names "Lap1", "Lap2", and so on, this field can be used:
[Lap{n}]Entering Complex Filters
The filter settings for a list offer an easy definition of your filter, for example:
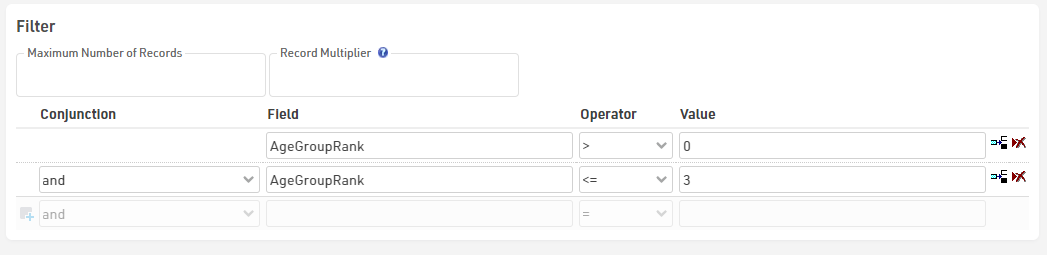
If you need to enter a complex nested filter, the GUI may be tedious. In that case simply enter your filter in the first line like this:
iif(([Contest]=2 AND T2>5) OR ([Contest]=3 AND T2=5); 1; 0) = 1
View
When viewing lists there are some additional functions and shortcuts to make working with the list and participant data easier.
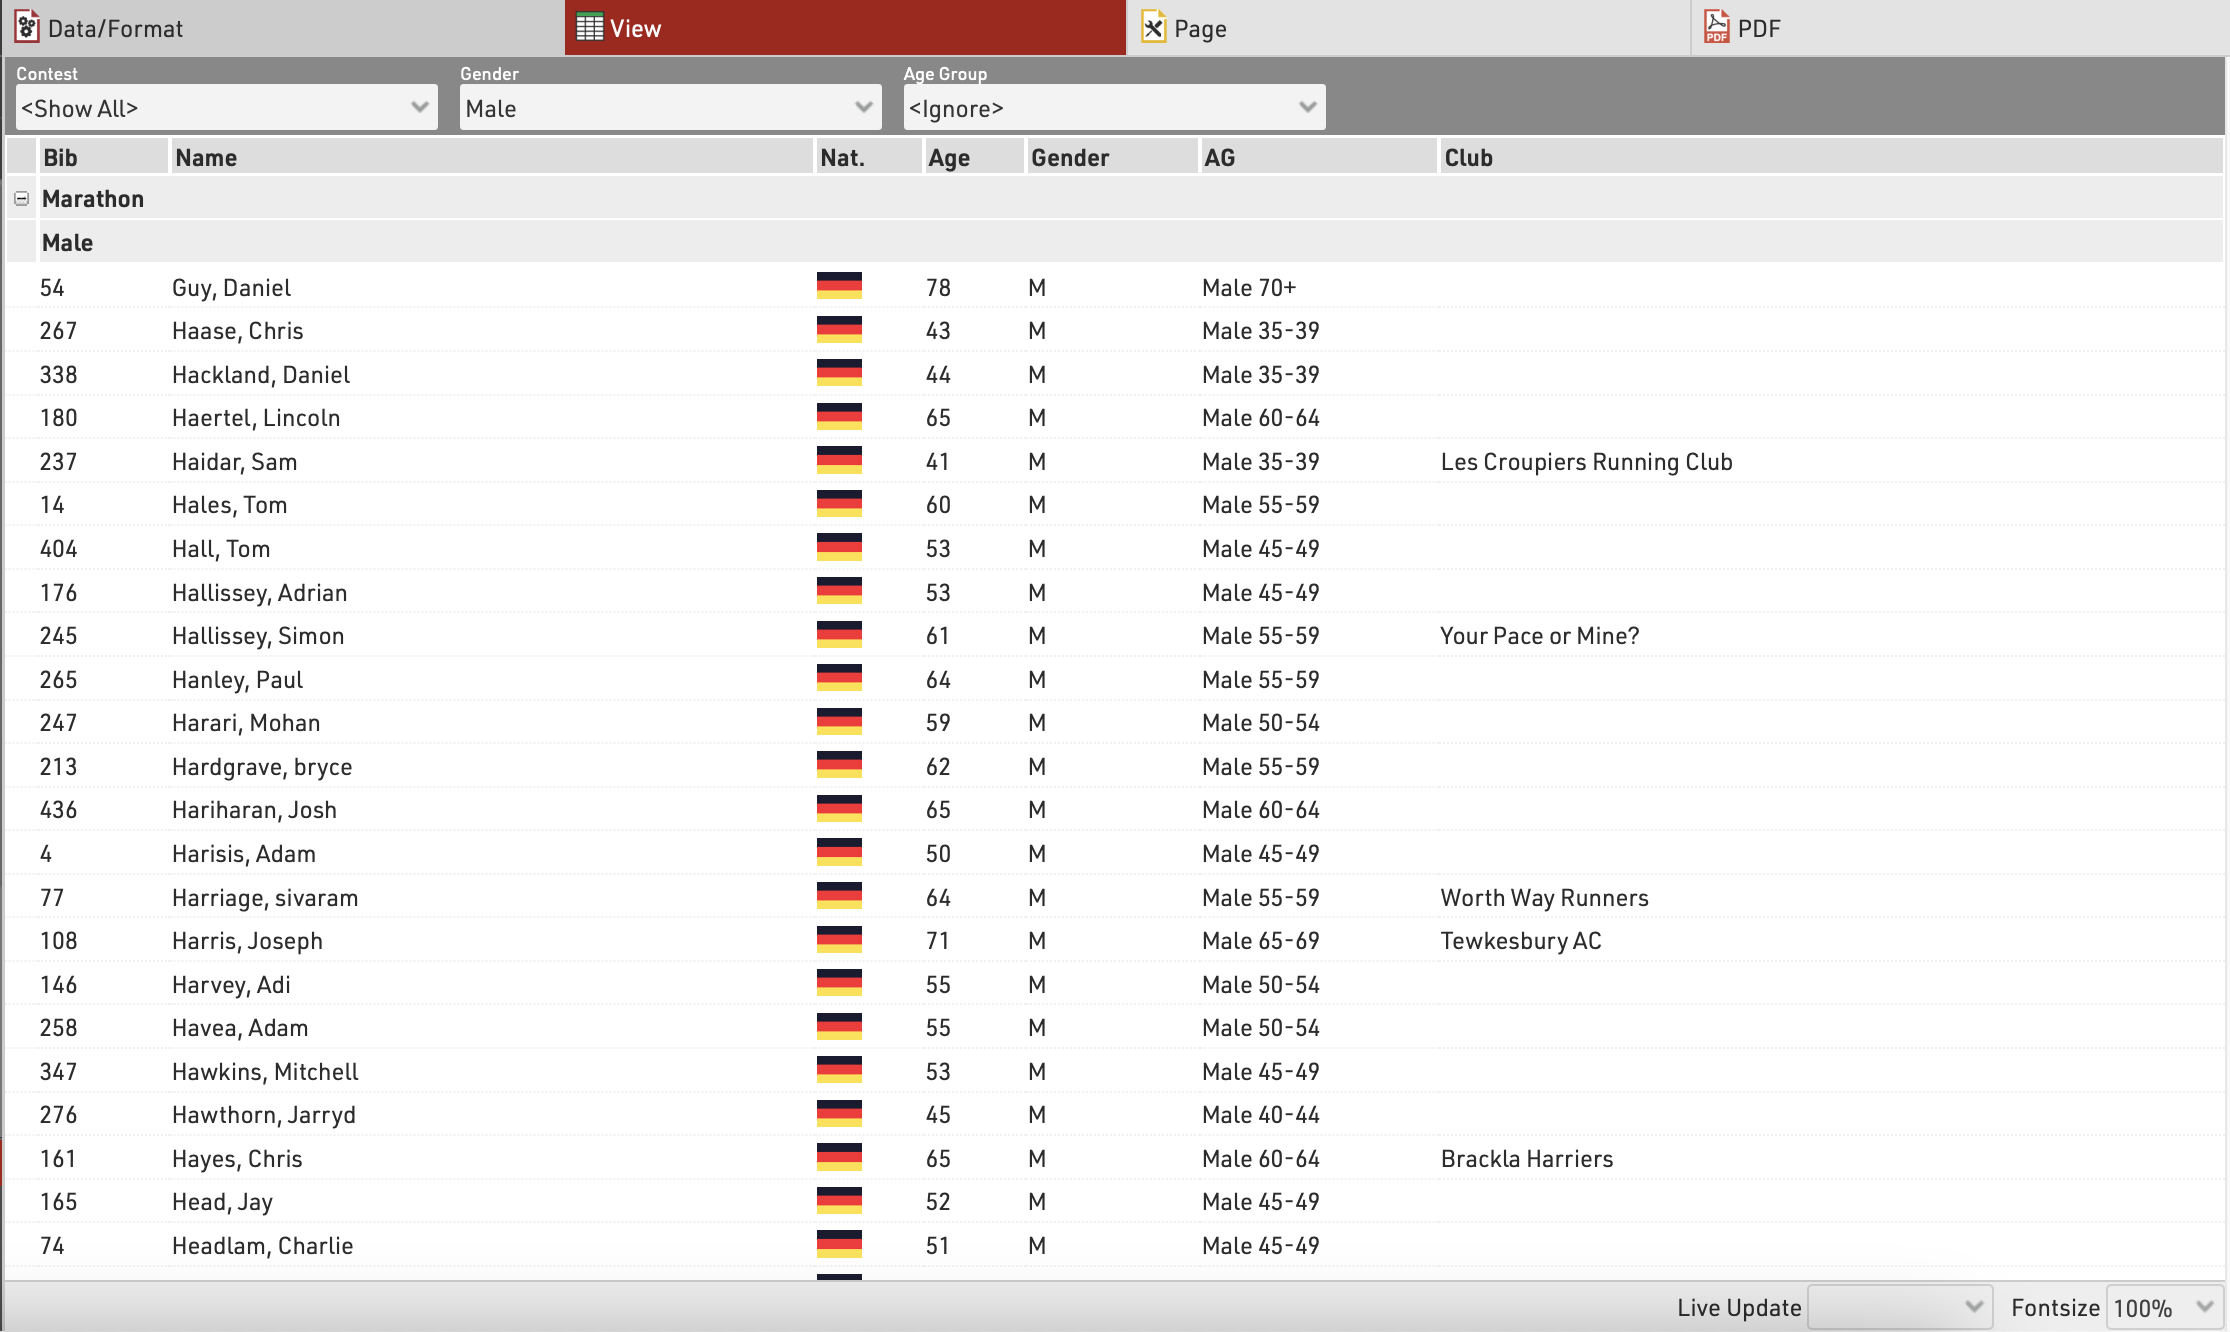
Any Filters you have applied to the list will be shown at the top of the list, allowing you to quickly filter to specific data sets. If using Groupings then the groups can be expanded or collapsed using the +/- icon at the start of the row.
Hovering over a row will highlight that entire row yellow.
Clicking on a row will open the Participants Tab directly to that participant record, if the right-side dock is open to the Participants Tab then it instead the participant record will be opened here.
Live Update allows you to set the list to automatically refresh at a pre-defined interval (from 1s to 60s), useful for monitoring specific lists during a race in an additional window.
Font size can also be adapted between 40% and 200%.
Page Settings
The settings in the Page tab are mostly relevant for the PDF output format as well as partially for the Presenter (marked with a *) and define how the records will be formatted and which additional information will be shown in the page header and footer.
Page Settings
Select here the page format, choose between portrait and landscape orientation and define the page margin in millimeters.
Multi Column
In some cases it can be helpful to split the page into several columns:
Simply define the number of columns and the column spacing in the Page settings of your list.
Background
The settings under Page Header allow you to put a picture in the top right corner of the report. However, if you require more flexibility regarding the design of the list, you can select a certificate at Design that will be shown in the background. This option gives you unlimited flexibility in designing your reports.
Cover sheet
Similar to the background, you can insert a certificate as additional Cover Sheet at the beginning of your report and an additional Back Sheet at the end of the report.
Page Header
Via these settings you can add and format the following elements of the page header: two header text lines*, the column headers*, a picture (which will be shown in the top right corner) and a gray line below the two header lines.
Records *
Define here the font type and size of the data records. Additionally, define if there shall be a thin line between the records and if every other line shall have a gray background. Via the Line Spacing setting you can define the height of the records.
Hint: Probably you would like to have the same font type throughout the entire report. Therefore, simply select the font type here and leave all other font type boxes empty. The font type for the records will then also be used for the header and footer texts.
Page Footer
You can add several texts and an image to the page footer. For example enter [Page] to show the page number in the footer of your report.
List Header and Footer
Enter an additional text that will be shown at the beginning/at the end of the list.
Output Selector
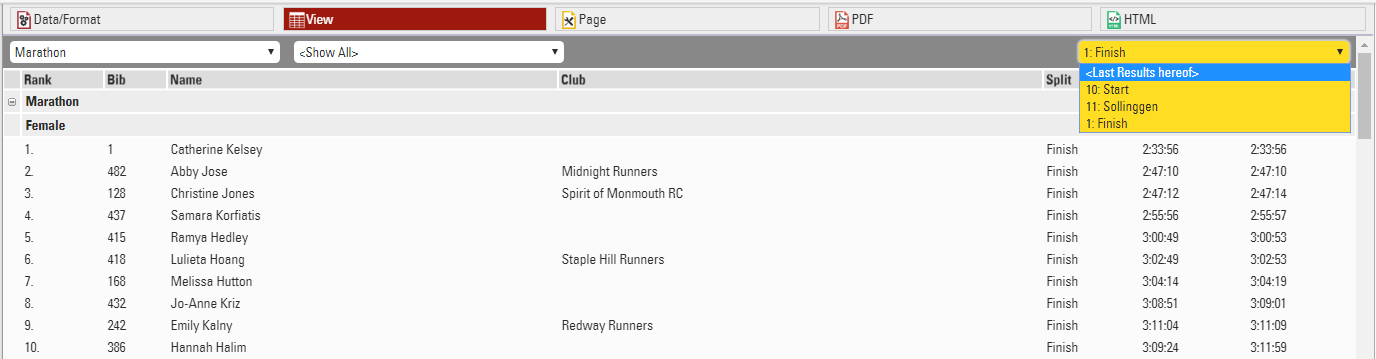
The output selector is designed to allow for easier creation of results lists which may otherwise require multiple output lists and ranks to be setup. It also includes an option to always show the last result which makes live results lists even easier to setup.
When the output selector is enabled an additional filter is shown which allows the user to select which result they want to look at, there are then a few different fields which can be used to show information according to which result is selected.
Splits Selector
To enable the drop-down selector for Splits there are 3 options for field names, of which one must be called in the Output.
- {Selector} - Will show all Splits and Legs in the drop-down
- {Selector.Splits} - Will show all Splits only in the drop-down
- {Selector.Legs} - Will show all Legs only in the drop-down
With these prefixes the standard Split/Leg field names can then be appended in the same way where {Selector} would be replaced by the selected Split or Leg name.
For example {Selector.Legs}.Distance would return the distance for the Leg selected from the drop-down.
Splits which are set to Internal Only will not be shown in the Selector or called in the <Last Results Hereof> option.
Results Selector
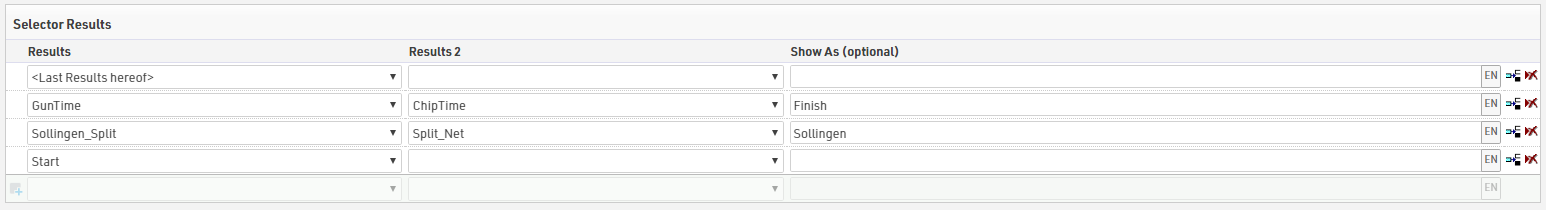
To enable the result selector you must include either SelectorDecimalTime or SelectorTime in the Data Fields of the output list, their functions are explained below. When included a new table will appear below the filter for Selector Results, in here you can select which results can be selected using the drop-down, if you are setting up a live results list then you can include <Last Results Hereof> which will when selected take the last result of those selected below which has a time and sort them from last result to first.
For each selected results you can choose to show up to 2 separate results, this could be for example a Gun Time and Net Time
Selector Fields
With the selector enabled there are now some additional fields which can be called which are relevant to the selected result.
SelectorDecimalTime / Selector2DecimalTime - This will return the decimal time in selector results 1 and 2 for the participant according to the selected result.
SelectorTime / Selector2Time - This will return the formatted time in selector results 1 and 2 for the participant according to the selected result.
SelectorTimePositive / Selector2TimePositive - Will return a 1 if there is a time in selector results 1 or 2 for the participant according to the selected result otherwise returns 0. Similar to TimePositive.
SelectorName - Returns the name of the currently selected result (Useful when using the Last Results Hereof when participants may be showing different results.
SelectorID - Returns the ID of the currently selected result if there is a time in that result.
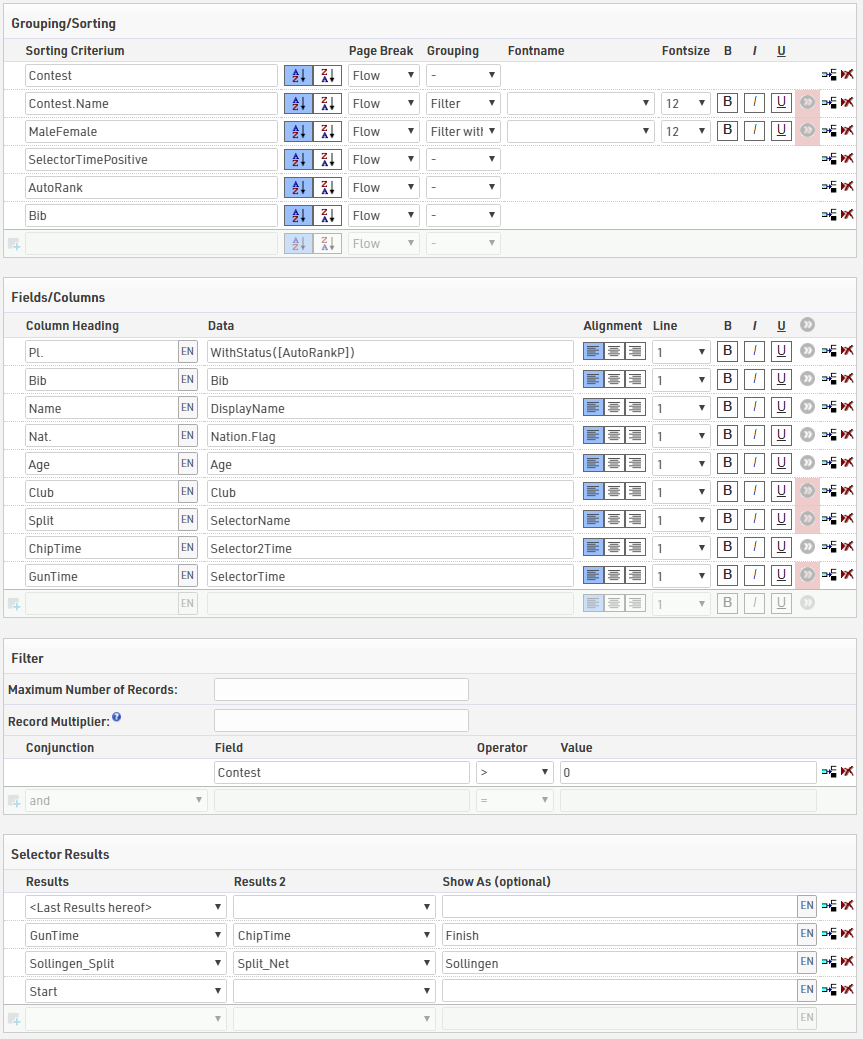
When using the Results Selector you can enable automatic ranking of participants by using the AutoRank field, to still show those who do not have a time at the bottom of the list you can first sort by SelectorTimePositive from largest to smallest so that those with a time are shown first.
Below is a typical setup that might be used for a live results list using the Results Selector
Inserting Images
Images can be inserted in to Output lists, these can be useful for functions such as linking to participant photos, videos or team logos.
Images can be inserted either from the event file pictures, a user-defined function or from an external URL link.
To insert an image use the code:
"[img:ImageName.png|height:30px]"
Ensuring that "ImageName.png" is the correct name and file ending of your image.
"ImageName.png" can be replaced with either your user-defined function or the URL of the image. When replacing the image name with a UDF or other data field you need to concatenate the data field name with the rest of the string.
"[img:"&[ImageUDF]&"|height:30px]"
If no height is defined then the image will be shown in full size.