The Output Window is used for the presentation / displaying of data, broken down to 5 categories (accessible from the buttons in the top-left corner).
Lists
The most important method for getting data out of RACE RESULT 12. Create any list of data - whether for printed results, publishing online results, results screens, tools for the announcer, your own checklists for verifying results or any custom report you need.
Certificates
A design tool for creating layouts with text and images on a page. They are mainly used for race certificates, but also for individual result print outs or to create receipts/invoices.
Certificate Sets
Determine which participants should receive a particular certificate, these sets can then be printed or published online or accessed through tools such as the Results Kiosk.
Labels
Create label sheets with rows and columns for printing personalised labels
Statistics
Create standard or custom statistics from the participants data.
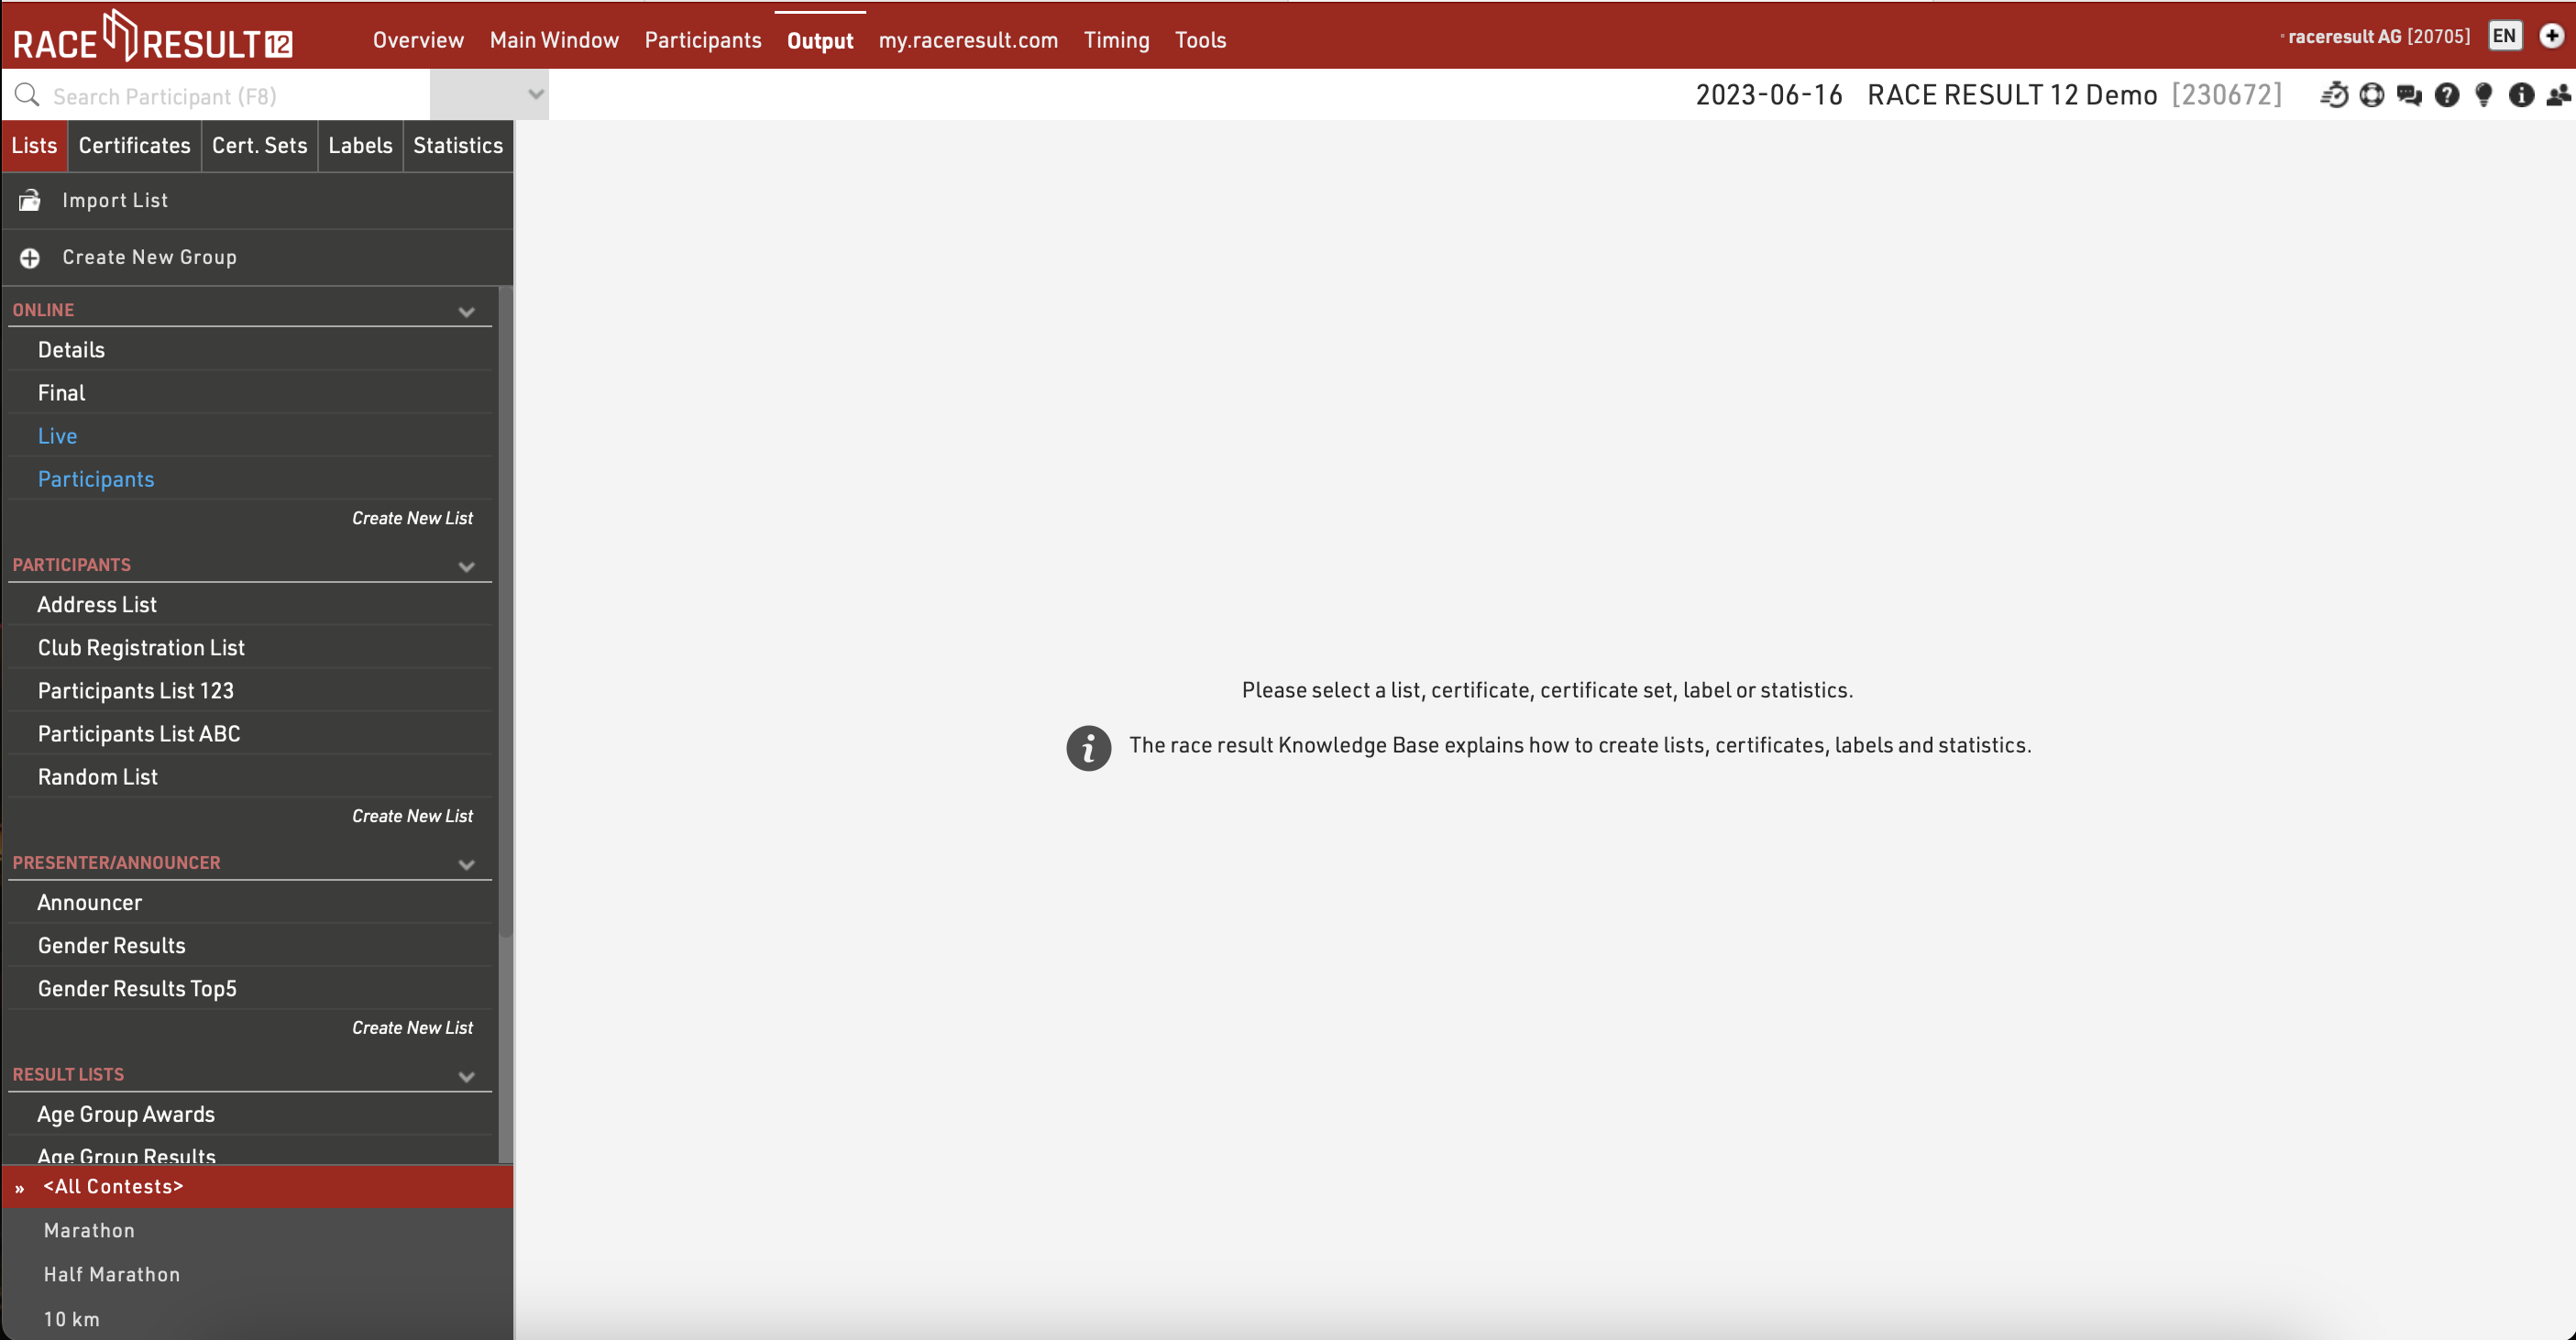
The bottom left contains a filter for Contests, by default Outputs will automatically be loaded for All Contests, but you can quickly filter an output to specific Contests by selecting them from this list, or select multiple Contests using the checkboxes when hovering an item.
Lists
Lists show a defined set of fields for a specific set of records. The settings of a list determine:
- which participants are shown
- which data fields (columns) are shown
- how the records are sorted
- how the records are formatted
- how the page is formatted (page format, margin etc)
Lists are additionally sorted into categories. By clicking the category head, the category can be collapsed and uncollapsed. To create a new category, click the New List Category link at the top. You can also rename List categories.
Lists can be sorted manually via drag&drop. Therefore move the cursor to the free space left of the list name. You can also drag&drop the list into another category. To sort the lists in a category alphabetically, click the  icon. Empty categories will be deleted automatically when you reload the window.
Clicking the name of an output list opens an overview page for that list.
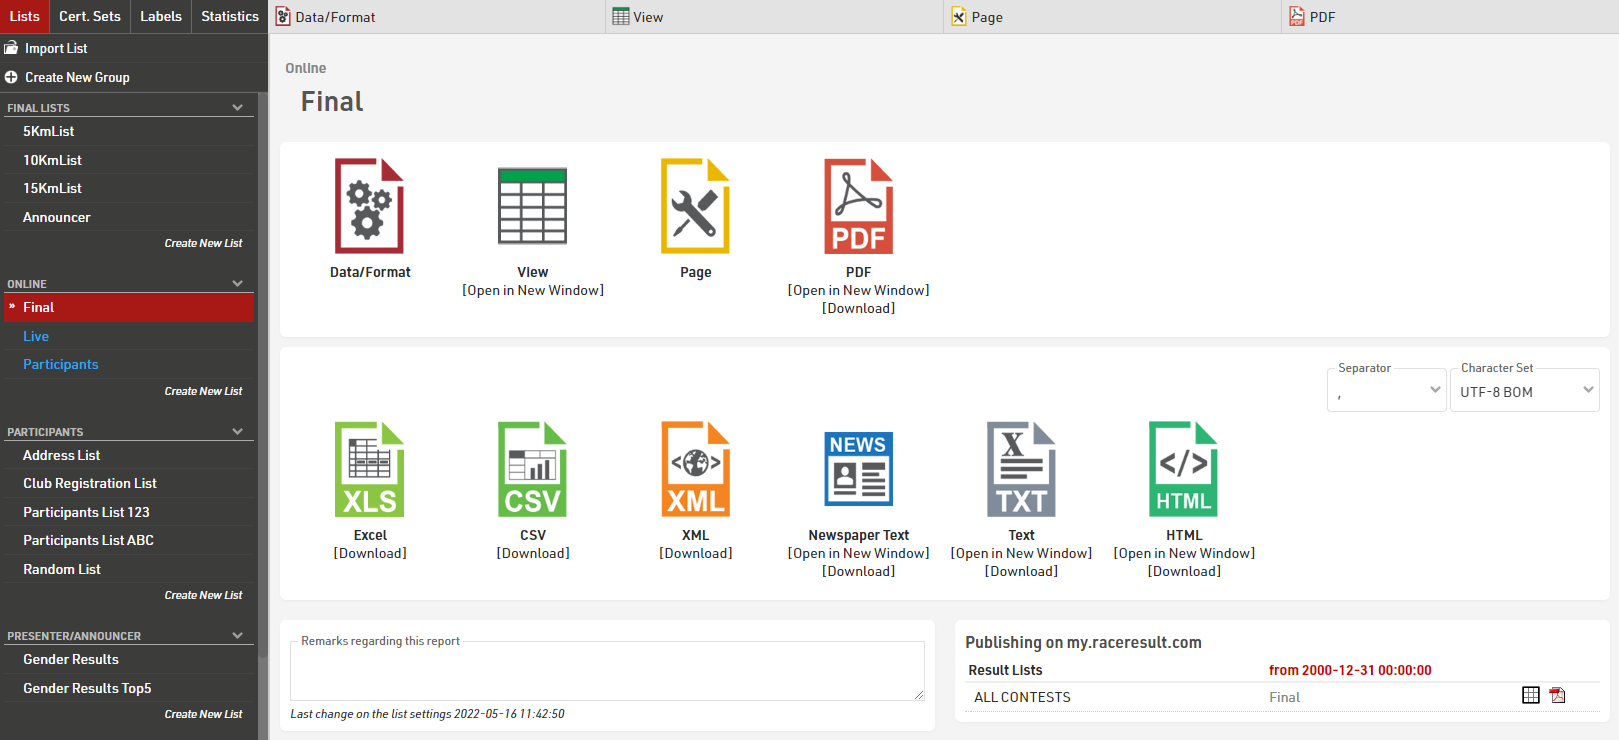
The settings of a list are split into the tabs Data/Format and Page. Data/Format contains all settings regarding the data shown on the list and how it is formatted, whereas the Page settings concern the general page layout and are only relevant for the PDF and HTML output form.
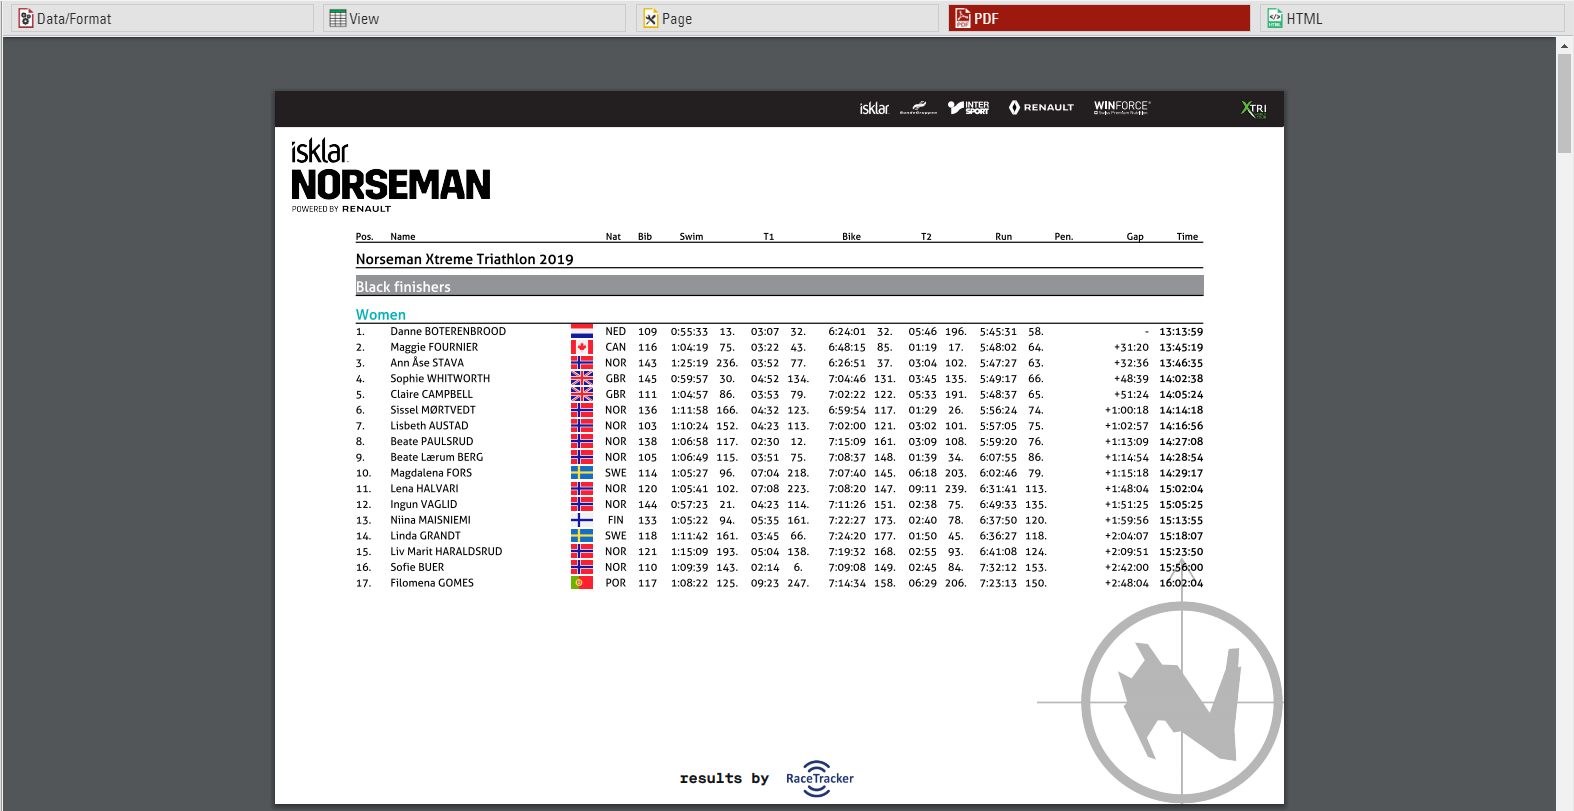
To view a list click the View button or tab, this can also be opened in a new window, lists can also be opened directly to the View tab by double clicking the list name from the menu. A PDF view of the list can also be previewed or downloaded.
Lists can also be exported in different formats as EXCEL, CSV, XML, TXT and HTML.
Data/Format Settings
The Data/Format Settings tab is divided into three sections: Grouping/Sorting, Fields/Columns and Filter. Each of those sections will be explained in the following. According to the settings and selections made in those sections, the participant data will be displayed in the outputlist.
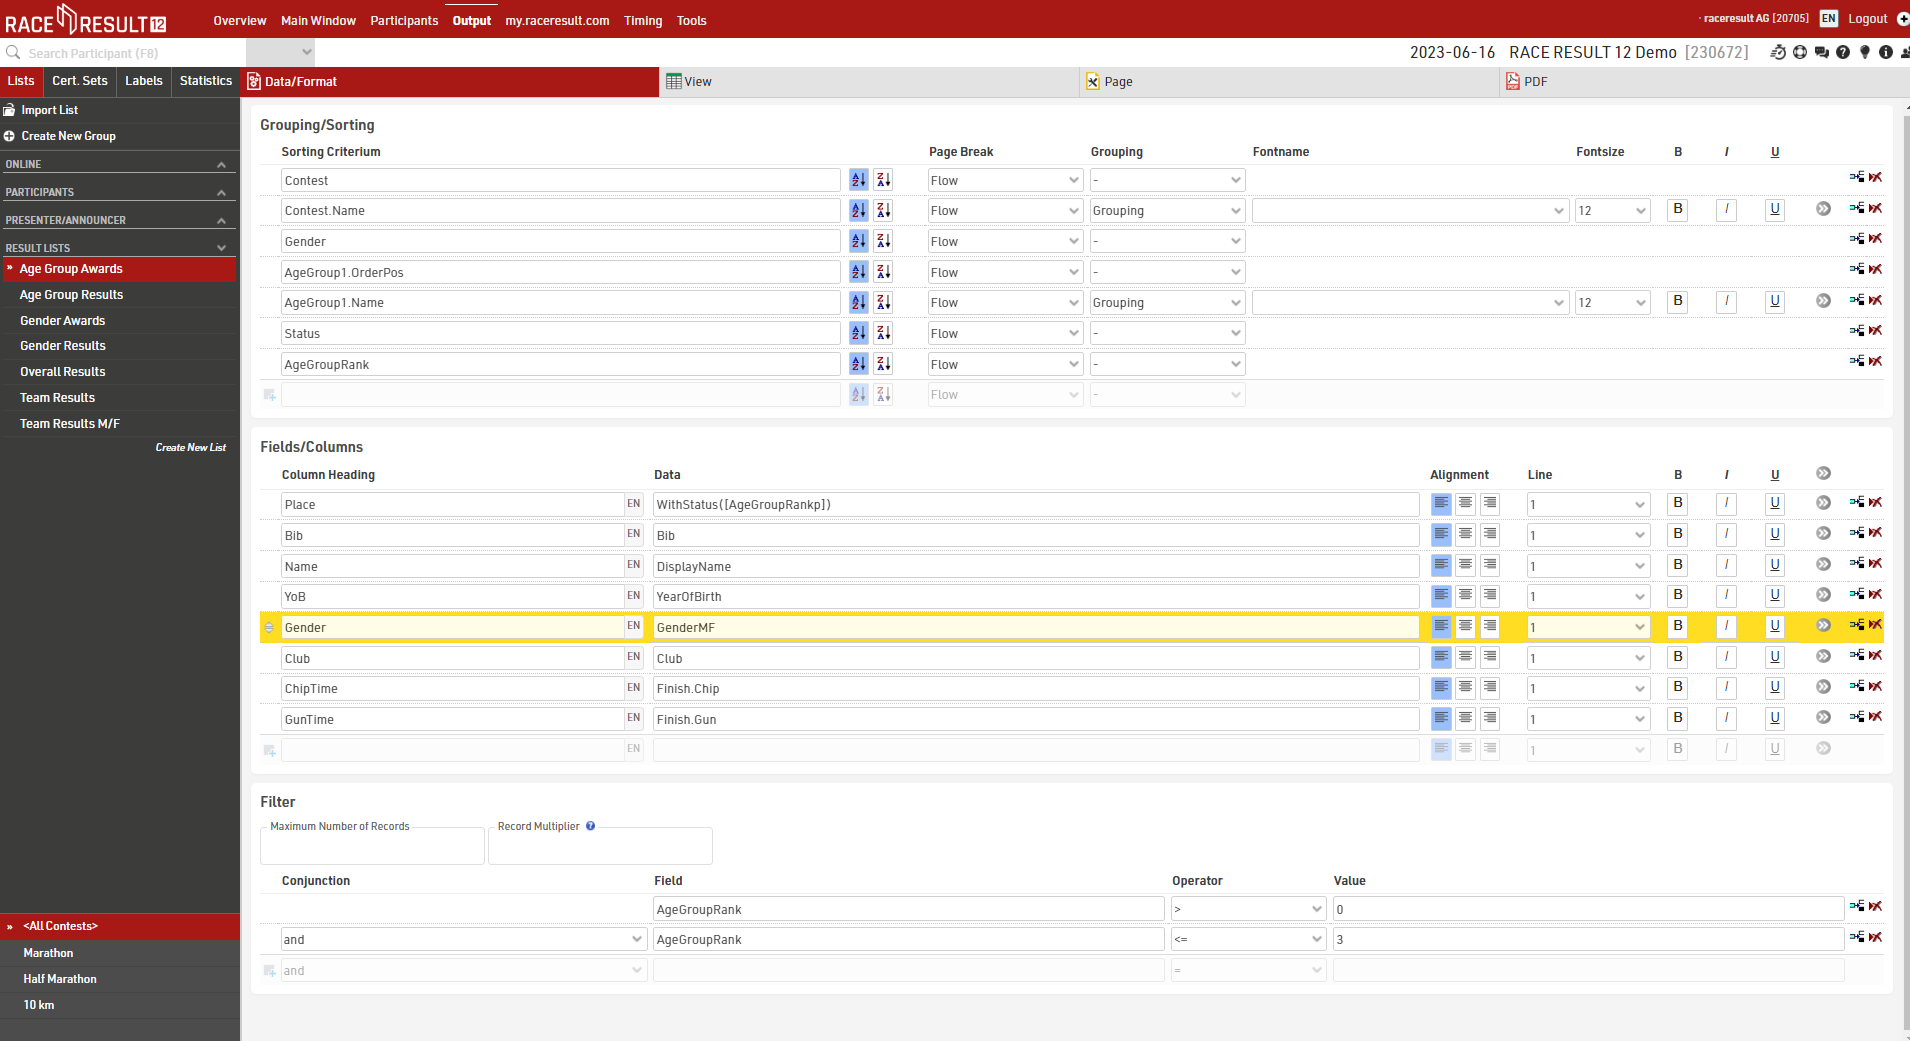
Grouping/Sorting
This section defines how the records on the list will be sorted. Simply select one or more fields from the Field Wizard which pops up below the input box. The list will be sorted by the first field and, if this field is not decisive, by the second, and so on.
Second, choose if the records shall be ordered ascending or descending.
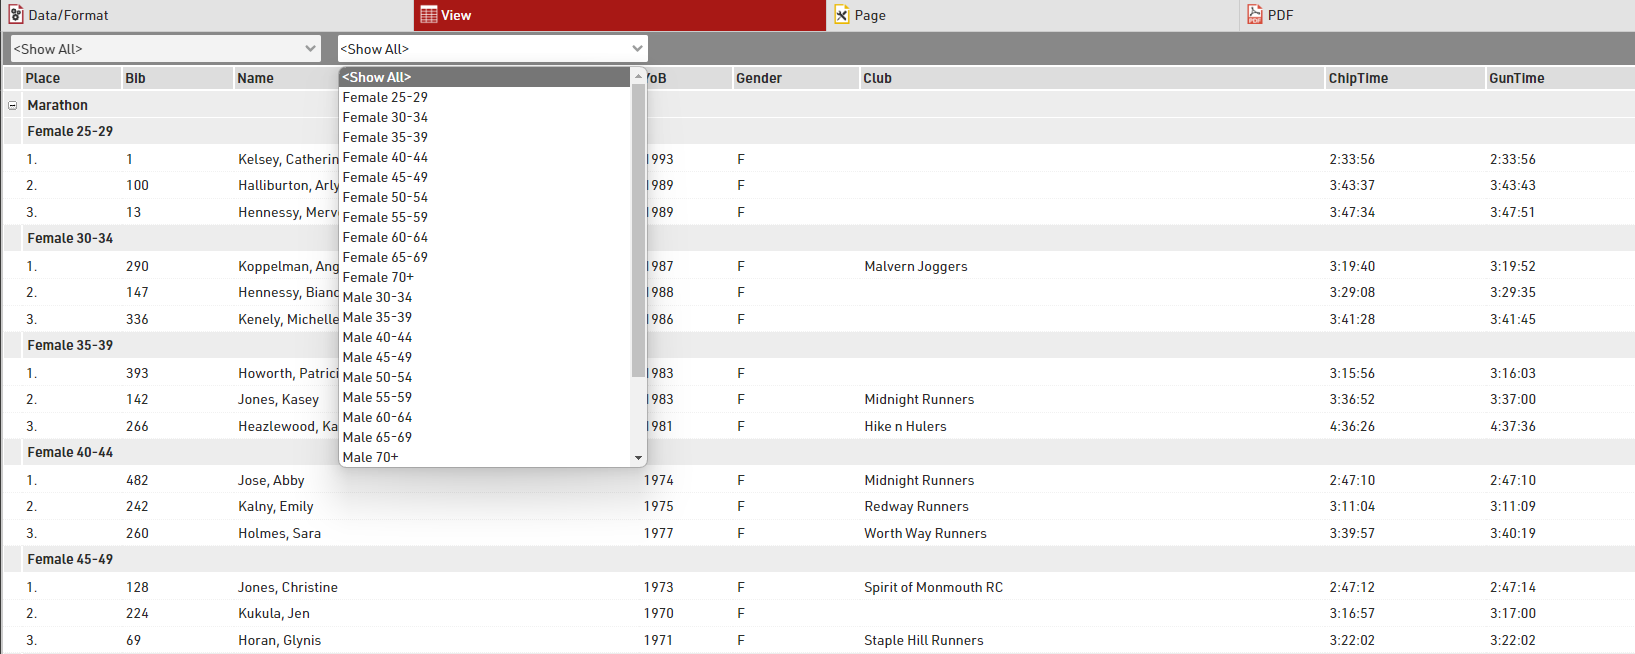
Fields can also be used as a Grouping or Filter, when used as a Grouping then a group header line will be inserted for each group value on all output types. Alternatively a list can be filtered by a group, with this setup an additional dropdown will appear in the preview and also on my.raceresult.com for each filter which can then show all groups, filter to a specific group, or ignore this level of grouping all together (if filter with ignore is selected). Filter is particularly useful for online results to make these easier to navigate / filter to the data somebody actually wants to view.
This list is grouped by contest and age group:
and below the same list using a filter instead of simple grouping
See Grouping/Sorting Details for more details and option
Fields/Columns
In the section Fields/Columns select the fields which shall form the columns of your report. In Column Heading enter a description of the field and in Data select a field from the Field Wizard or enter an expression. For example, using an expression you can combine the fields Lastname, Firstname and YearOfBirth to: "Doe, John (70)"
The corresponding expression would be:
[DisplayName] & "(" & [YearOfBirth] & ")"
Select a line number greater than 1 to create Multi-Line Lists.
Click the more details for this field  button to access the Extended List Column Settings.
Filter
By setting a Filter you can exclude certain records from the report. If you do not define a filter all records will be shown on the report.
In particular, filters are important for result lists: you would like to show only those participants that have already finished. Usually, the filter will be that the rank must be greater than 0.
Instead of setting a filter, you can also limit the number of records shown on the list by setting a maximum number of records.
Besides, the Record Multiplier allows to show records more than once with different information (e.g. lap times) on a list.
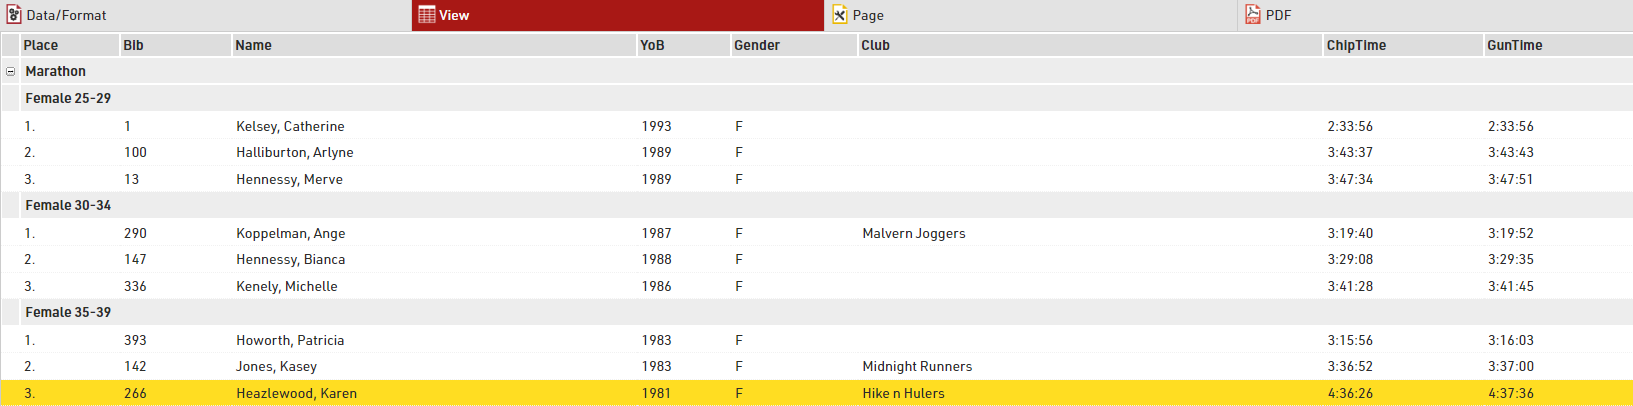
View
When viewing lists there are some additional functions and shortcuts to make working with the list and participant data easier.
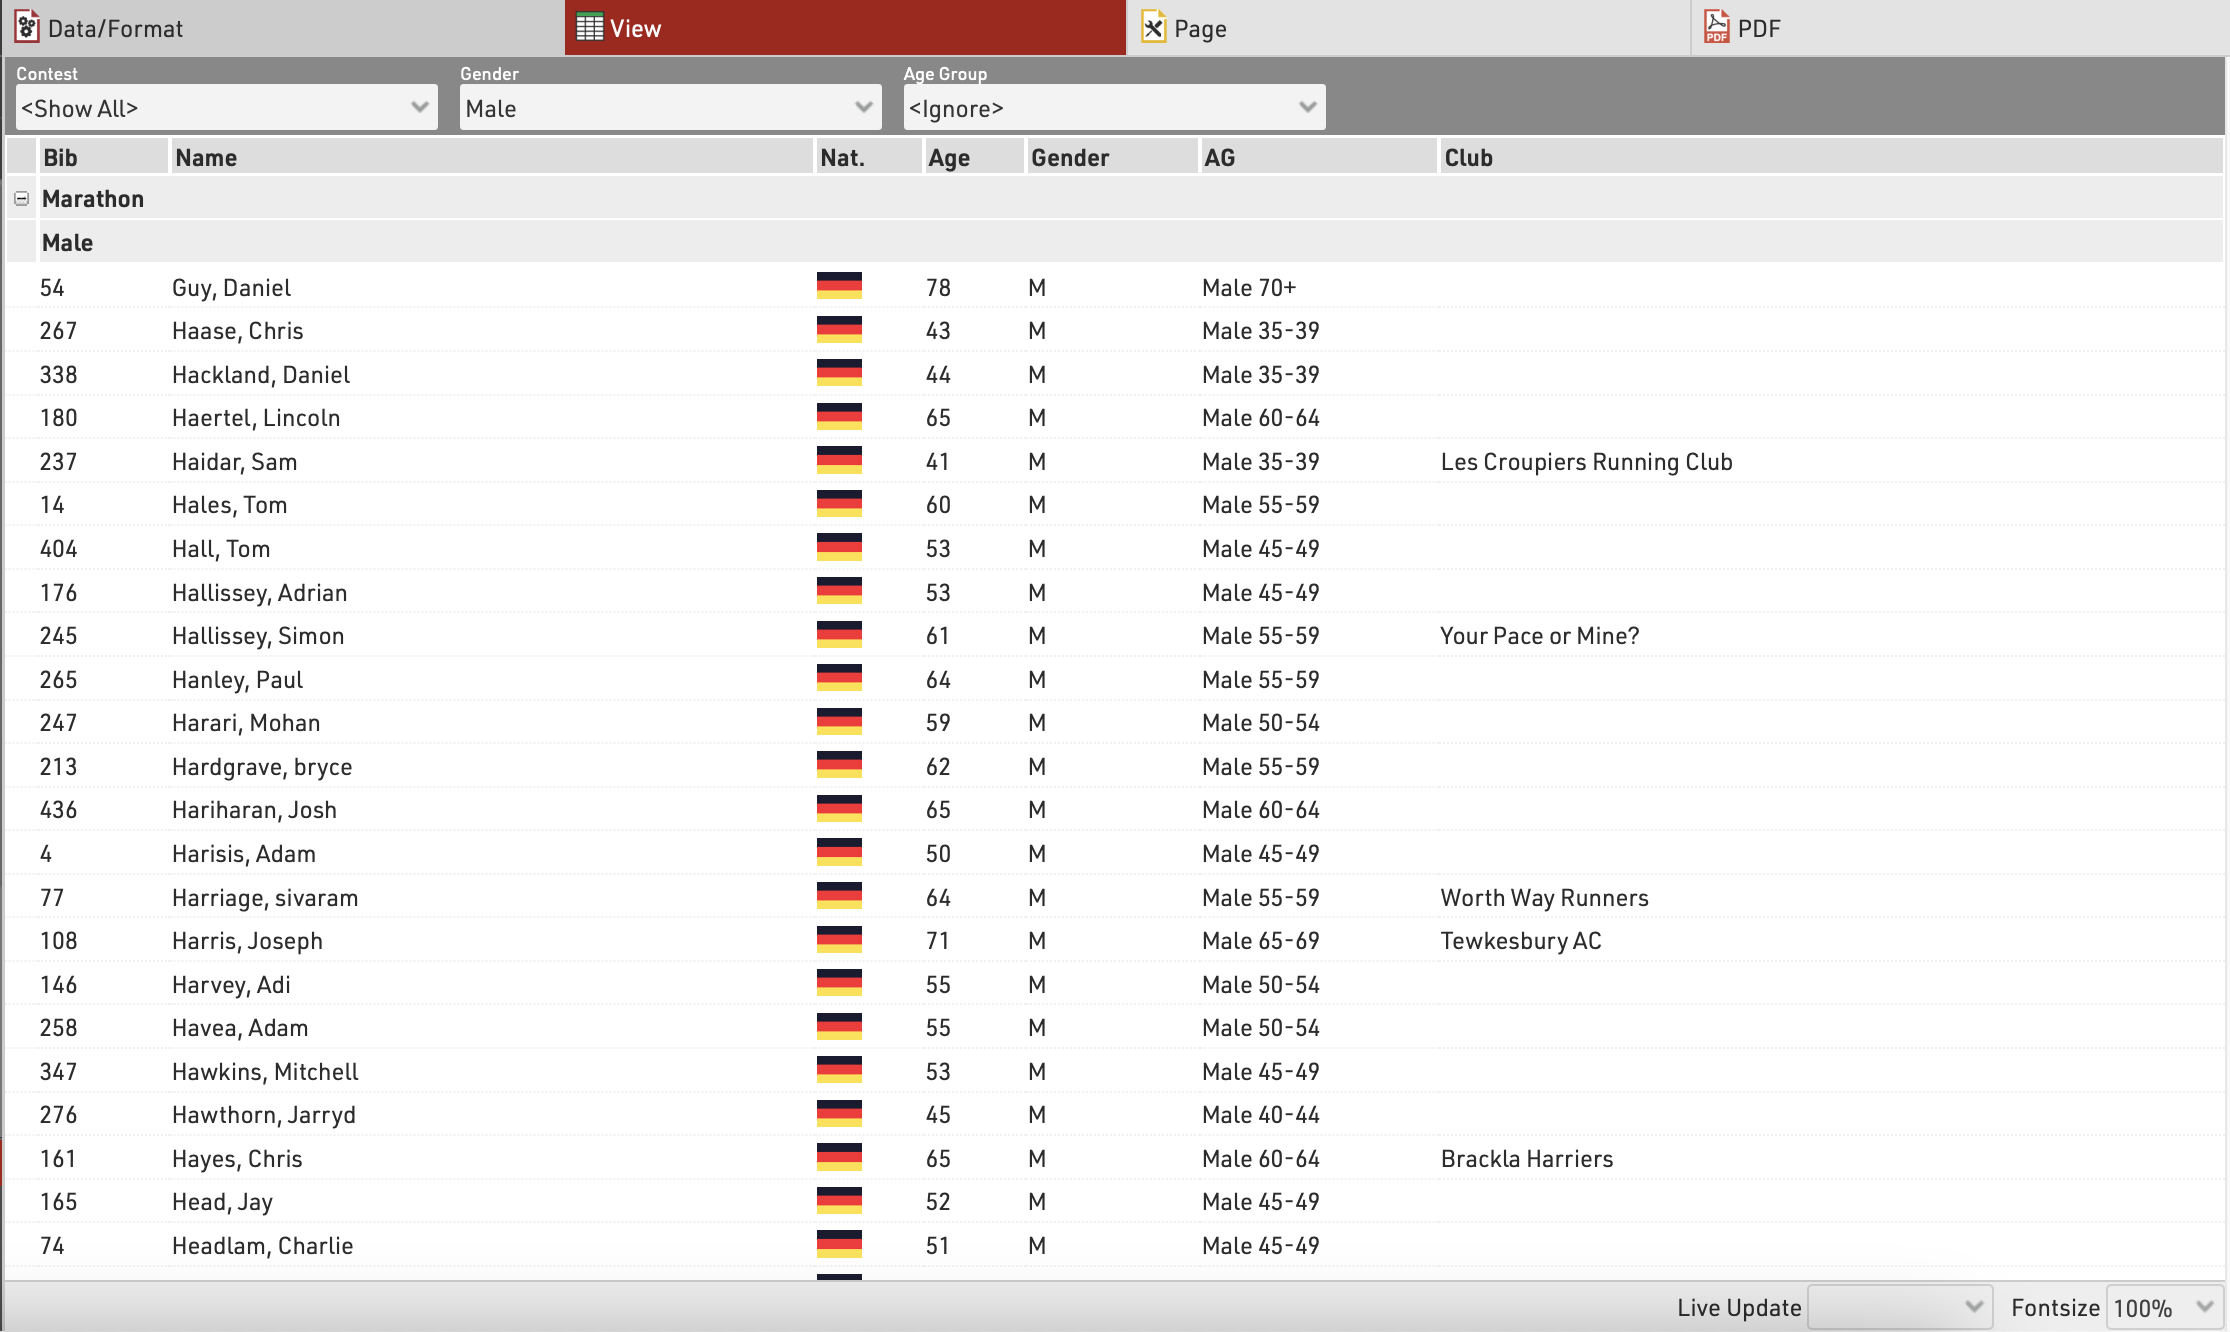
Any Filters you have applied to the list will be shown at the top of the list, allowing you to quickly filter to specific data sets. If using Groupings then the groups can be expanded or collapsed using the +/- icon at the start of the row.
Hovering over a row will highlight that entire row yellow.
Clicking on a row will open the Participants Tab directly to that participant record, if the right-side dock is open to the Participants Tab then it instead the participant record will be opened here.
Live Update allows you to set the list to automatically refresh at a pre-defined interval (from 1s to 60s), useful for monitoring specific lists during a race in an additional window.
Font size can also be adapted between 40% and 200%.
Page Settings
The settings in the Page tab are mostly relevant for the PDF output format as well as partially for the Presenter (marked with a *) and define how the records will be formatted and which additional information will be shown in the page header and footer.
Page Settings
Select here the page format, choose between portrait and landscape orientation and define the page margin in millimeters.
Multi Column
In some cases it can be helpful to split the page into several columns:
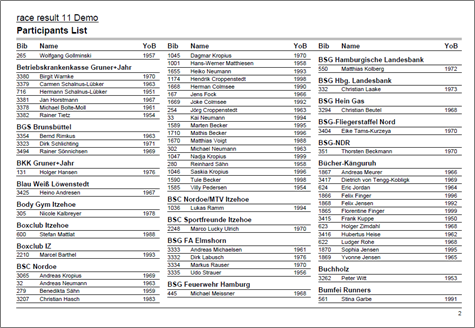
Simply define the number of columns and the column spacing in the Page settings of your list.
Background
The settings under Page Header allow you to put a picture in the top right corner of the report. However, if you require more flexibility regarding the design of the list, you can select a certificate at Design that will be shown in the background. This option gives you unlimited flexibility in designing your reports.
Cover sheet
Similar to the background, you can insert a certificate as additional Cover Sheet at the beginning of your report and an additional Back Sheet at the end of the report.
Page Header
Via these settings you can add and format the following elements of the page header: two header text lines*, the column headers*, a picture (which will be shown in the top right corner) and a gray line below the two header lines.
Records *
Define here the font type and size of the data records. Additionally, define if there shall be a thin line between the records and if every other line shall have a gray background. Via the Line Spacing setting you can define the height of the records.
Hint: Probably you would like to have the same font type throughout the entire report. Therefore, simply select the font type here and leave all other font type boxes empty. The font type for the records will then also be used for the header and footer texts.
Page Footer
You can add several texts and an image to the page footer. For example enter [Page] to show the page number in the footer of your report.
List Header and Footer
Enter an additional text that will be shown at the beginning/at the end of the list.
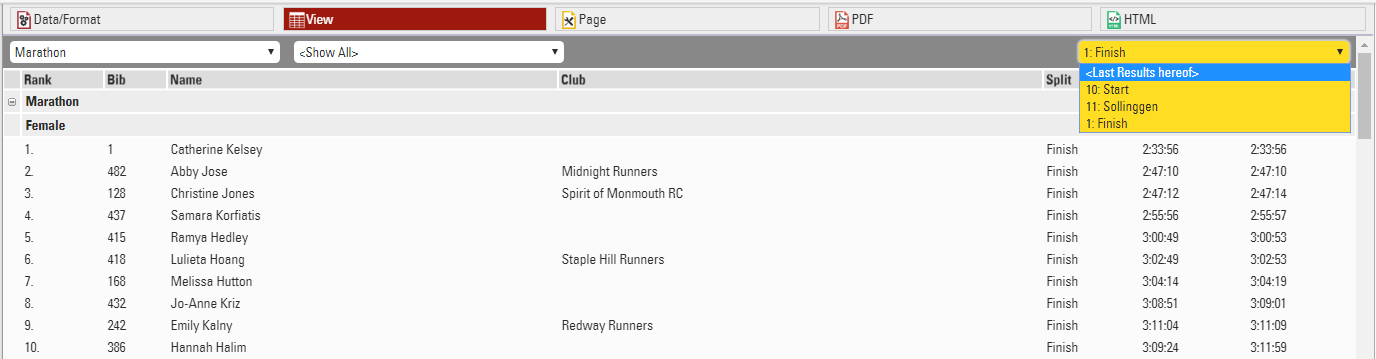
Output Selector
The output selector is designed to allow for easier creation of results lists which may otherwise require multiple output lists and ranks to be setup. It also includes an option to always show the last result which makes live results lists even easier to setup.
When the output selector is enabled an additional filter is shown which allows the user to select which result they want to look at, there are then a few different fields which can be used to show information according to which result is selected.
Inserting Images
Images can be inserted in to Output lists, these can be useful for functions such as linking to participant photos, videos or team logos.
Images can be inserted either from the event file pictures, a user-defined function or from an external URL link.
To insert an image use the code:
"[img:ImageName.png|height:30px]"
Ensuring that "ImageName.png" is the correct name and file ending of your image.
"ImageName.png" can be replaced with either your user-defined function or the URL of the image. When replacing the image name with a UDF or other data field you need to concatenate the data field name with the rest of the string.
"[img:"&[ImageUDF]&"|height:30px]"
If no height is defined then the image will be shown in full size.
Certificates / Certificate Sets
Contrary to a List, a Certificate creates a page for each participant. Texts and pictures can be placed freely on the page. A certificate primarily serves to:
- Print name, time, etc. on a pre-printed certificate during the event.
- Displaying/Printing of certificates on my.raceresult.com (complete with background image).
In addition, certificates can be used for:
- other print-outs, such as confirmation of registration, invoices, receipts, lap reports at a 24h-race, etc.
- Background image for a List
- Cover sheet and closing page for a List
- Content of Labels
Certificate layouts should first be created in the Certificates tab which opens the design tool to create different layouts for different purposes.
Once you have a certificate setup, Certificate Sets define for which participants a certain certificate will be created. You can edit the settings of a Certificate Set by clicking on Settings after selecting the certificate set in the Output Window.
Certificate Sets serve to print sets of certificates. To print out single certificates, go to the Certificates tab in the Participants Window.
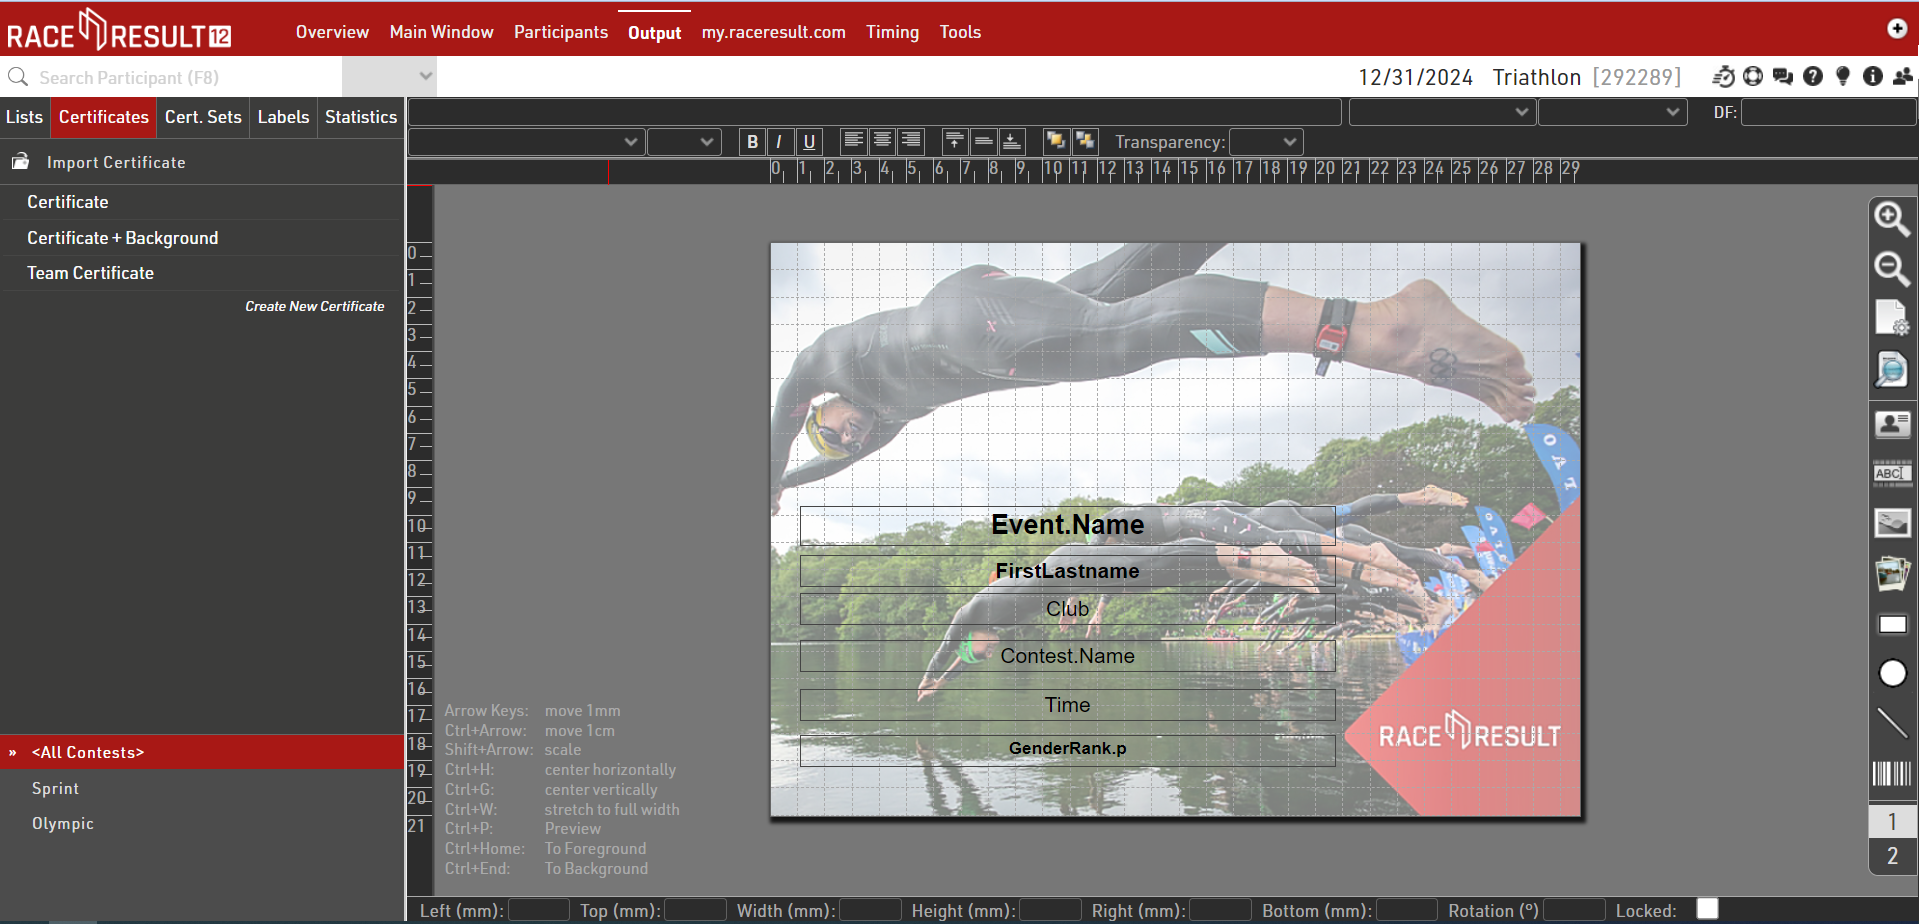
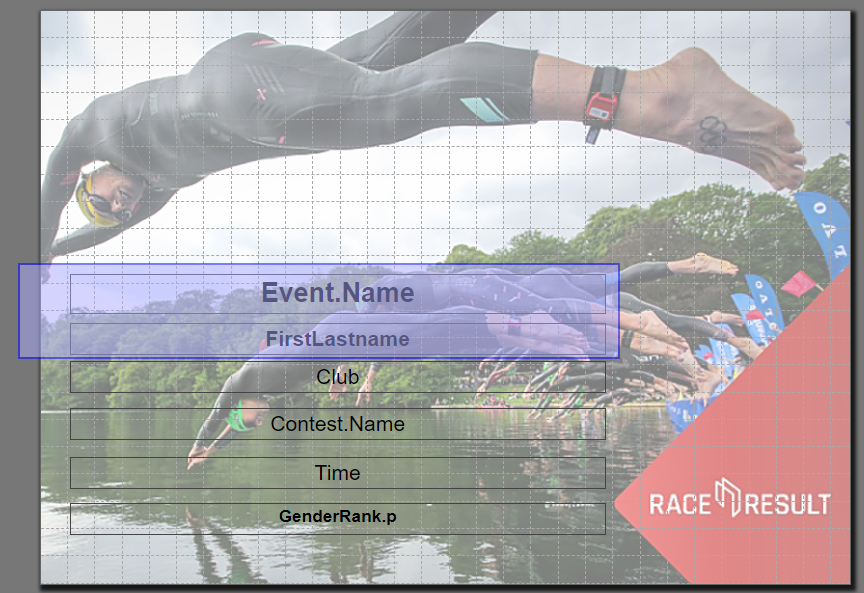
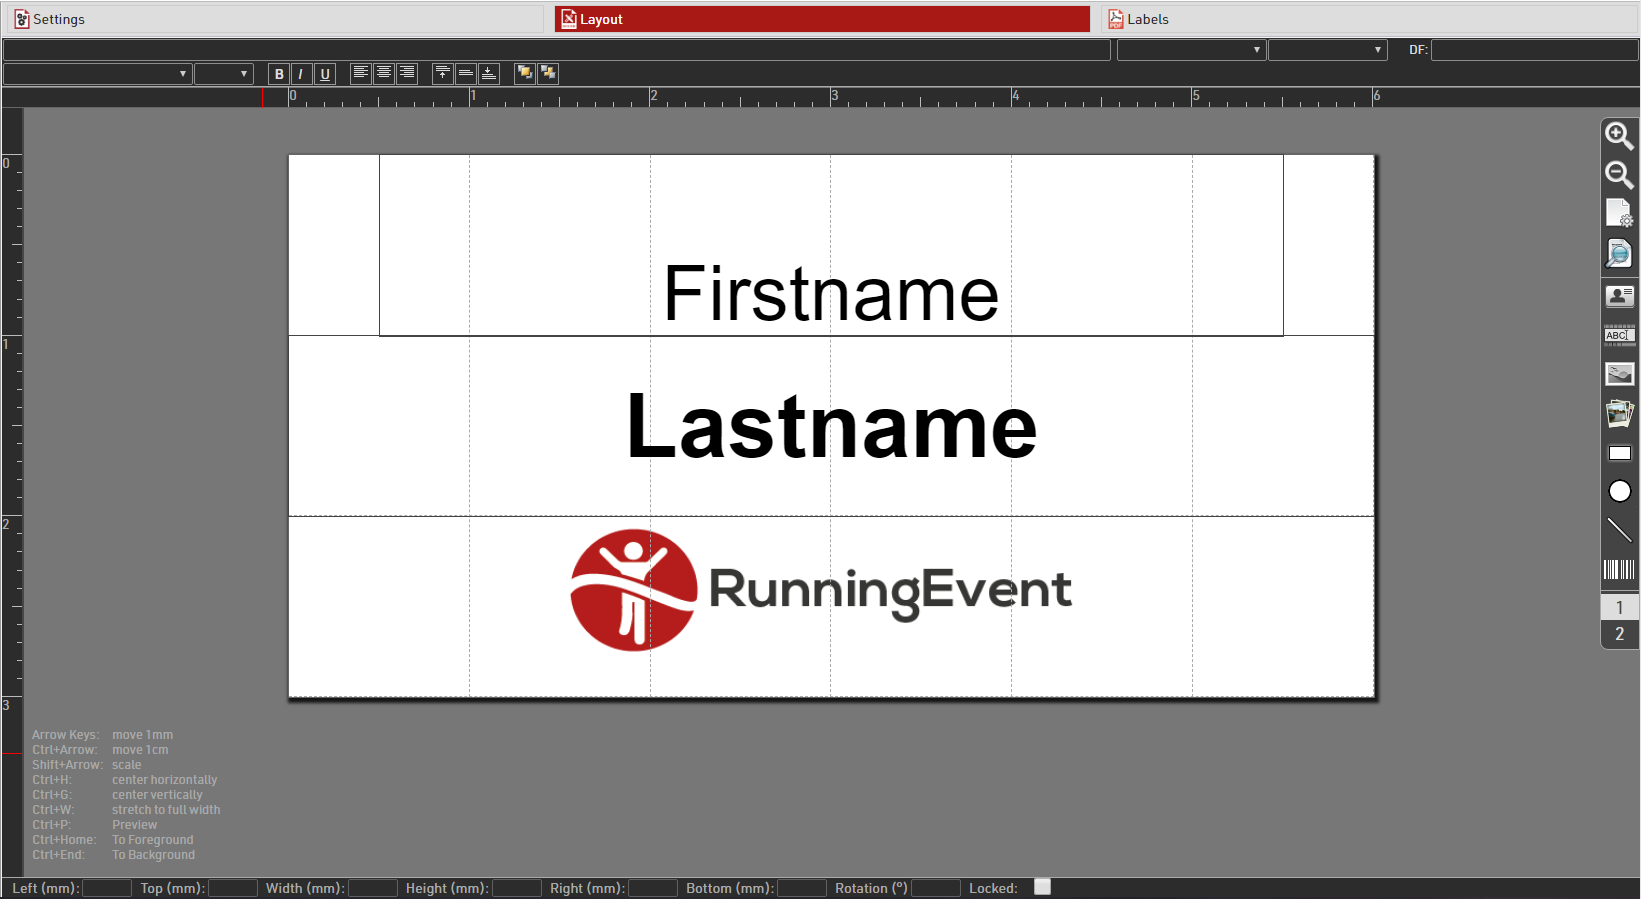
Certificate
The Certificate serves to design certificates or designs for labels and as background for lists.
The list on the left shows all certificates in your event file. After clicking one of them you can see a preview on the right side.
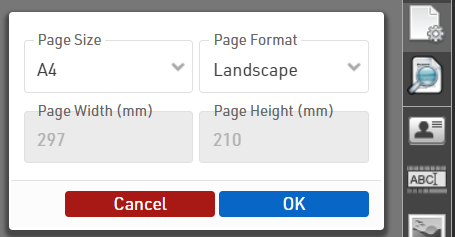
Page Settings
First, define the page size and choose between landscape and portrait orientation:
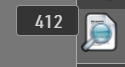
Preview
At any time you can render a real preview of the certificate for any bib number using this button:
Adding Elements
The menu on the right offers different types of elements that can be placed on the certificate:
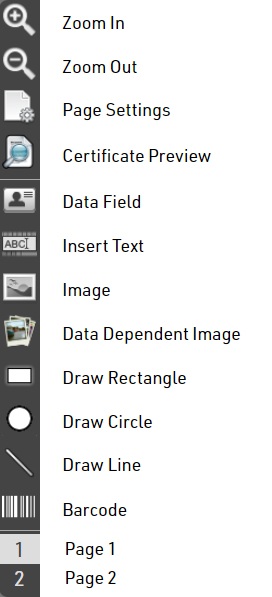
Data Field
You can enter a Field or an Expression in a Data Filed to display specific participant data. The example below displays the participant's first name.
Firstname
Using an expression you could display static text with dynamic text.
"Gender Rank: "&[GenderRank]
Text
The Text element can be used to display static text. Note, that you can not set Dynamic Formatting for text elements. Only Data Field elements can have Dynamic Formatting.
Image
The Image element can be used to display static images. When selecting this element, you will be given the option to select an image from the list of available images in your event file or from the available folders.
Data Dependent Image
The Data Dependent Image element can be used to display dynamic images using an Expression. The Expression should evaluate the name of the image, including the image extension (eg. .jpg).
For example, you can use the field Nation.Alpha2 in an expression to evaluate the name of each image file. The below would be evaluated to "flag_DE.jpg" assuming the participant was from Germany.
"flag_" & [Nation.Alpha2] & ".jpg"
Another example would be if you wanted to use a Control Function like an if() statement to determine what image to display. Here is one example
if([GenderRank] IN "1-3";"Winner.jpg";"Blank.jpg")
Shapes (Rectangle, Circle, and Line)
You can use the Rectangle, Circle, or Line options to display colored shapes. Using Dynamic Formatting, the colors can change dynamically for each participant.
Barcode/QR Code
You can encode any Field or Expression in one of the below format options.
- Barcode 39
- EAN 13
- Barcode 128
- QR Code
Element Setting Bar
Each element listed above has various settings. Not all available settings work for all elements. These settings are located at the top of the certificate window.
Top Row

The left text box is where you enter a field or expression for a given element. This is used for Data Field, Text, Image, and Data Dependent Image elements.
The two center drop-down lists pertain to team scores. This is discussed in more detail further down in this article.
The right text box labeled DF stands for Dynamic Formatting. Dynamic formatting can be used to change the formatting of an element dynamically. For example, you could change the text color depending on the participants finishing place.
if([GenderRank] IN "1-3";"C(#ffdb4d)";"C(#000000)")
Bottom Row

The bottom row of options has standard text formatting options like bold, italics, and unlined text. There are also options for text alignment within a text box, layering options, color, text outline, and element transparency.
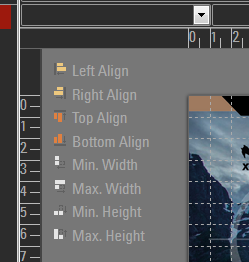
Aligning Elements
After adding an element to the certificate you can position and scale it on the certificate with the mouse. Alternatively, you can use the cursor keys (see keyboard codes in the bottom left corner) or use the entry fields at the bottom of the screen to position and scale the element.
Select several elements at the same time by clicking and holding your mouse button and dragging the selection rectangle over the elements.
Alternatively, you can hold the Ctrl key on the keyboard and click one element after the other.
Then, these functions appear in the top left corner to align the elements:
Pages
Optionally, a certificate can include more than one page. Simply click on "2" in the toolbar on the right to access page 2. Once you have placed an element there, you can add a page 3 and so on.
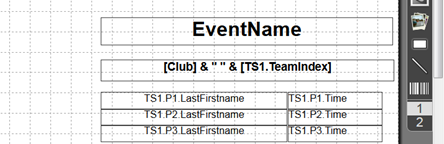
Team Certificates
Certificates for teams work exactly the same as a normal certificate. Instead of the individual rank and time, you would show the team’s rank and time. If you would like to show also information on the other team members, you can simply enter the field/expression in the top left corner and then select the team score and the participant.

For example, to show the last name of the second participant of the team (according to team score 1), the system will use the field TS1.P2.Lastname. In the preview, you can see that selecting a team score/participant only helps you to set up your certificate, but internally the field name will be used.
Certificate Set
Certificate Sets will be created in the Output Window. A certificate set contains the Certificates for certain participants in a given order. The settings for a certificate set decide:
- for which participant a certificate will be created
- which certificate (layout) is used
- how the certificates are ordered
For example: the certificates of the first three of each age group ordered by the age group name and the age group rank.
Select a certificate set in the Output Window and then click on Settings to access the following settings:
Certificate Layout
First, select the Certificate layout which should be used.
Then choose if you would like to create individual or team certificates. If you choose Team Certificate (1 per Participant), certificates will be created only for members of a team. If you select Team Certificate (1 per Team) a certificate will be printed only for the first member of each team.
For which Participant do you want to create certificates?
You can further limit for whom certificates will be printed. Oftentimes certificate sets are filtered by a rank, for example if you want to print certificates for only the best three. You can also enter a general filter.
Order of the Certificates
Determine in what order the certificates will be created.
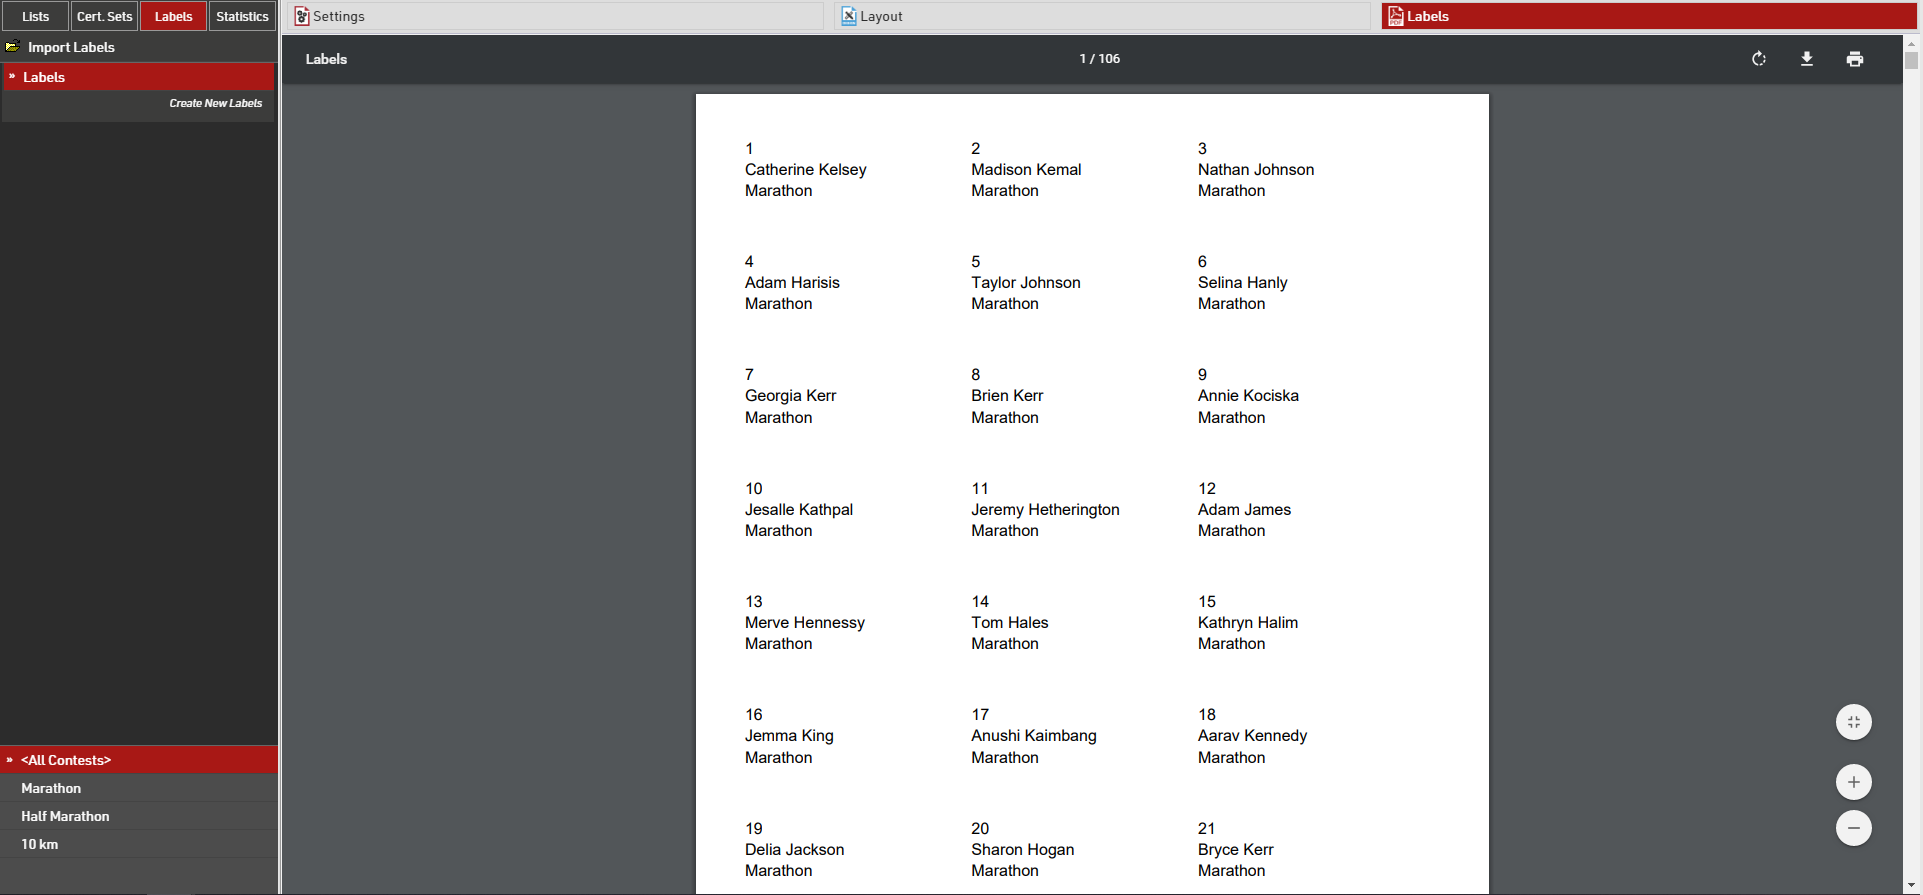
Labels
Labels are normally printed on pre-cut label sheets and allow you to place either text or a certificate design on each label.
The Label Settings determine the basic layout and template for the labels.
Participants
A Filter that defines for which participants a label will be created.
Sorting Fields that define how the labels will be sorted.
Content
Enter an Expression that defines the content for each label.
Other
The Directional layout (row / column direction) of the labels.
Optionally a design to be printed instead of the Expression, see Labels with Design, if a design is selected then it can be edited directly through the Layout tab.
Optionally replace the content of the label with an automatically generated Barcode for each label, the barcode will include the bib number.
Font
Define the font, font size, formatting and alignment for text.
Page
Page settings for each sheet, these are normally provided by the manufacturer of the label sheets.
Label
The individual label sizing / spacing, these are normally provided by the manufacturer of the label sheets.
Once the settings are defined you can preview, download and print the labels through the Labels tab, an example might look like this.
Labels with Design
If you need more flexibility regarding the design of the labels, you can remove the expression in the settings and instead select a certificate that will be printed on each label. For example:
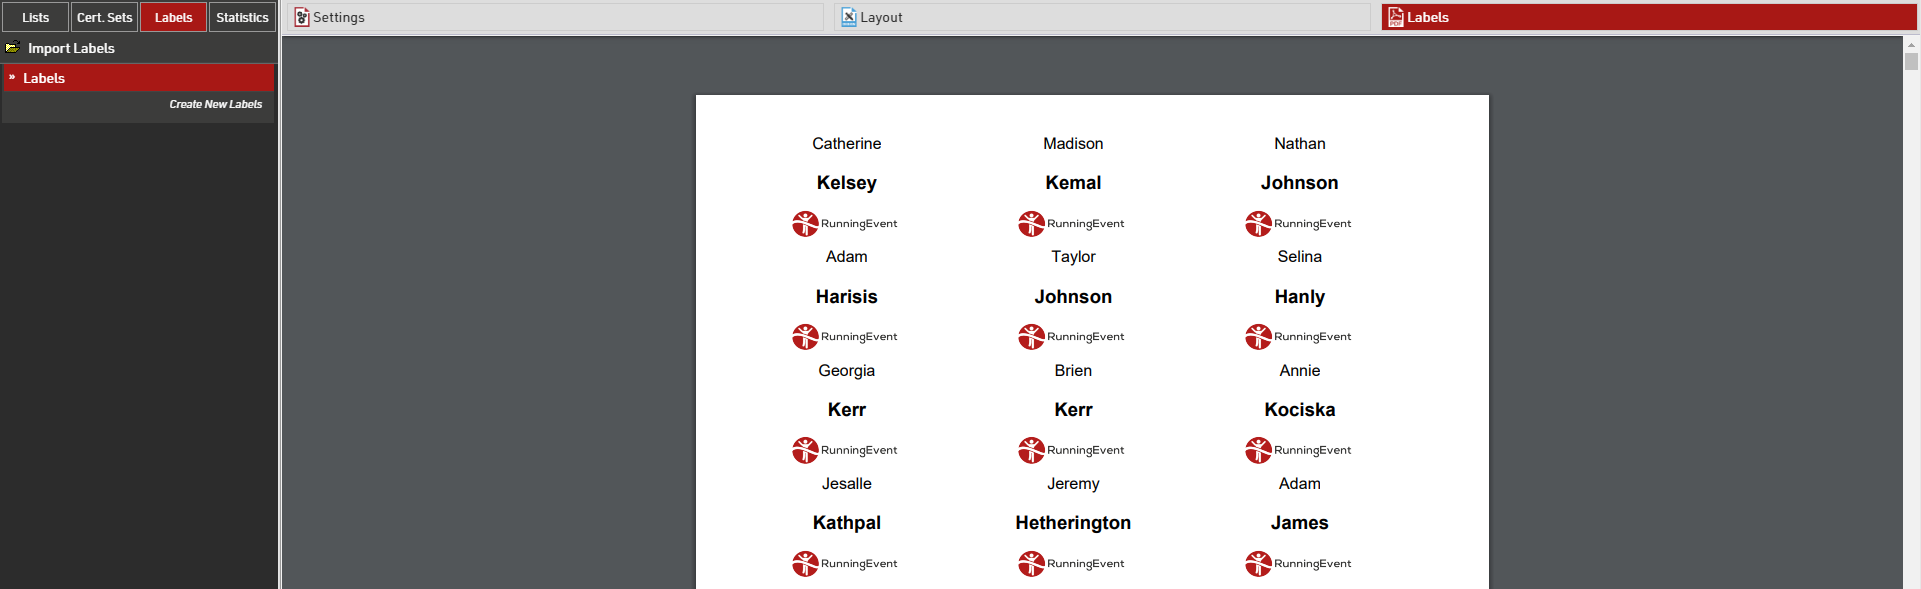
If a certificate is selected, you can click the tab Layout to open the Designer and edit the certificate:
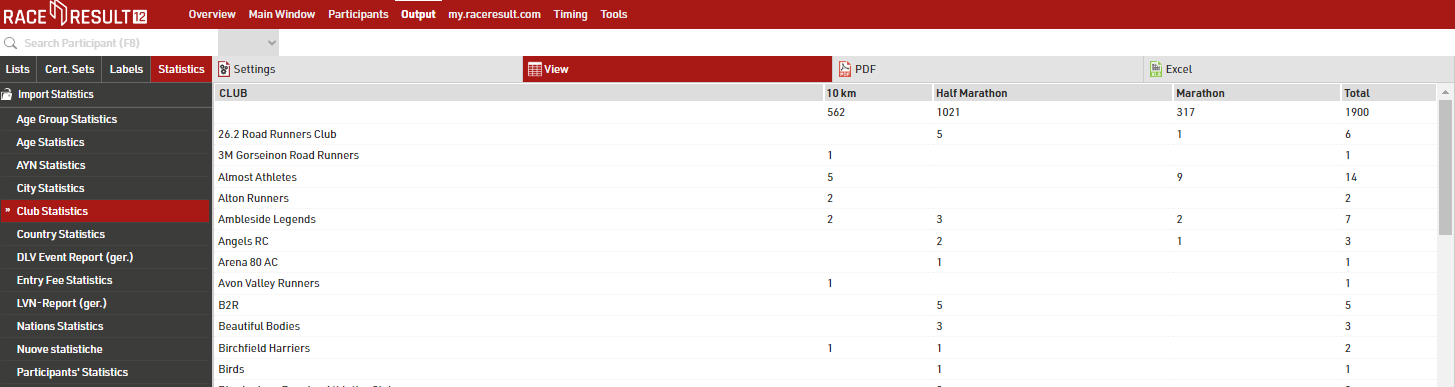
Statistics
Every new event file has numerous default Statistics, for example Club Statistics that shows the number of participants per contest and Club:
Create new type of statistics
You can easily create a new type of statistics. The most relevant settings are Rows, Columns, Field, and Mode.
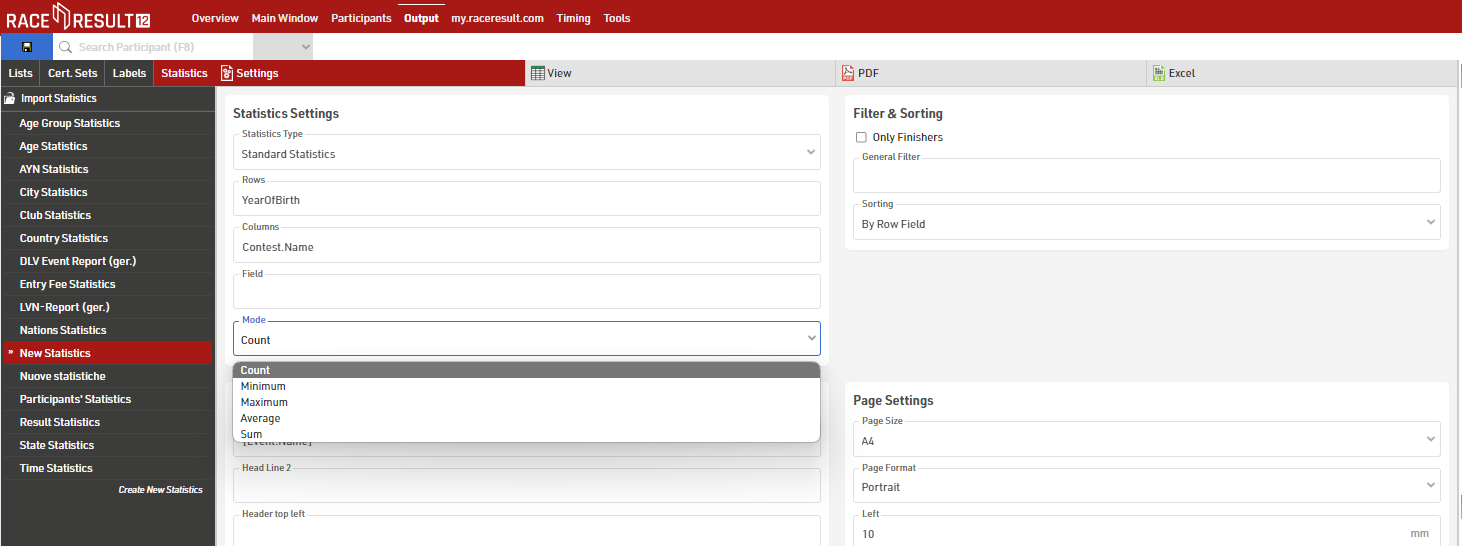
In most cases you will use the mode Count: the number of participants matching the row and the column field will be counted.
Alternatively, you can select a field over which the minimum/maximum/average/sum will be calculated.
If you want to restrict the participants considered for the statistics, enable Only Finishers or enter a General Filter.
Special Types of Statistics
Besides these statistics there are some special types of statistics:
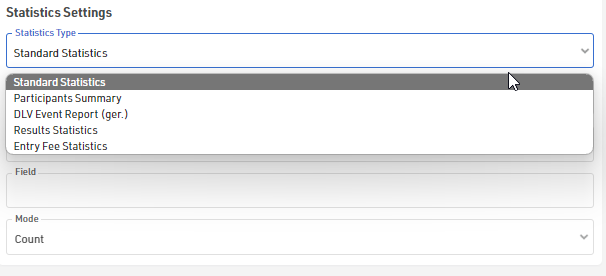
- Participants Summary creates a PDF with a general statistics of the event.
- DLV and LVN Event Report are reports for German federations.
- Results Statistics shows how many participants have a time in each result.
- Entry Fee Statistics lists all entry fees and calculate the sum over all participants for each entry fee.
- AYN Statistics lists all AYNs and shows how many participants are ticked for the respective AYN.
Dynamic Formatting
Dynamic Formatting allows to format the individual records of Lists and Certificates differently, for example men could be printed in blue and women in pink.
An Expression is used which generates a text with formatting instructions. This expression is entered for lists in the Extended Column Settings and for Certificates.
The formatting text can contain several instructions which are separated by semicolons:
Element1;Element2;...
These elements can be:
|
B |
Bold |
| I | Italic |
| U | Underlined |
| S | Strike-Through |
| AL | Align Left |
| AC | Align Center |
| AR | Align Right |
| C(X) | Font Color X |
| BG(X) | Background Color X |
| T(X) | Transparency level (0-100%) |
|
BTC(X) / BRC(X) BBC(X) / BLC(X) |
Border Top / Right / Bottom / Left Color X |
| BTW(X) / BRW(X) BBW(X) / BLW(X) |
Border Top / Right / Bottom / Left Width X |
| FS(X)* | Font Size X in pt |
| OC(X)** | Outline Text Color X |
| OW(X)** | Outline Width X Value 0-5 in 0.5 increments |
* only applicable to outputs in PDF and certificates in Designer. For PDF outputs X must be smaller than the default font size.
**only applicable to certificates in the Designer
Possible color values are:
See more information on colours HERE
Examples
A field will be printed italic for women:
if([Sex]="f"; "I"; "")
A field is formatted with a red background and white text for participants with Age less than 18.
if([Age]<18; "BG(#FF0000);C(#FFFFFF)"; "")
A field is marked red for participants from USA:
if([Nation.IOC]="USA"; "C(255,0,0)"; "")
Colors
The Colors of the text elements on Lists and Certificates can be adjusted. By default all texts are shown in RGB-black.
RACE RESULT 12 supports RGB colors as well as CMYK colors.
The colors of the columns in a list can be edited in the Extended Column Settings. You can use the following formats:
- a hex value, like in HTML (RGB), e.g. #FF3300
- RGB as a decimal value, e.g. 255,51,10
- CMYK as a decimal value, e.g. 30,30,30,100
In Certificates, both RGB and CYMK colors can be set via the tool bar at the top of the screen.
With the help of Dynamic Formatting, fields can be formatted differently for each data record.
The following website is useful for picking colours and can convert between HTML, RGB and CMYK: https://html-color-codes.info/
CMYK Colors
RGB colors
RGB is a color space for screen colors. The colors on your monitor are put together by the components R=red, G=green and B=blue. An RGB color value consists of three values between 0 and 255 which are often specified as hexadecimals between 00 and FF. The higher the value, the stronger the color - white has the value #FFFFFF or (255,255,255) and black has the value #000000 (0,0,0).